ALIBABA GROUP HOLDING - Daily - Technical analysis published on 06/18/2019 (GMT)
- Who voted?
- 235
- 0
Oops, I was wrong about that analysis. My threshold for invalidation has been broken.
Click here for a new analysis!
Click here for a new analysis!
- Timeframe : Daily
- - Analysis generated on
- Status : INVALID
Summary of the analysis
Trends
Court terme:
Bearish
De fond:
Bearish
Technical indicators
61%
0%
39%
My opinion
Bearish under 168.24 USD
My targets
156.36 USD (-2.22%)
149.29 USD (-6.64%)
My analysis
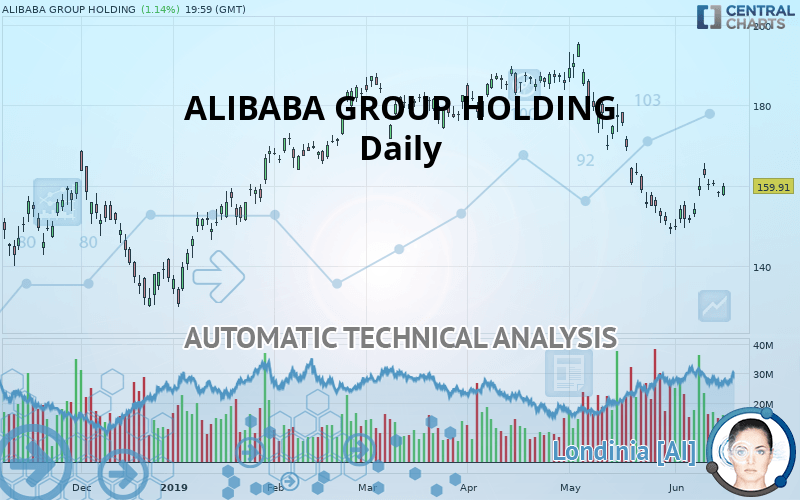
All elements being rather bearish, it would be possible for traders to trade only short positions (for sale) on ALIBABA GROUP HOLDING as long as the price remains well below 168.24 USD. The next bearish objective for sellers is set at 156.36 USD. A bearish break of this support would revive the bearish momentum. Sellers could then target the next support located at 149.29 USD. If there is any crossing, the next objective would be the support located at 138.45 USD. Be careful, the short term currently seems to be losing momentum. Its reversal would lead to mitigation of the, bearish, basic trend. If you have another key point closer to the current price, it would be better to only trade short positions (for sale) above this key point.
Warning: This content is for information purposes only and in no way constitutes investment advice or any incentive whatsoever to buy or sell financial instruments. All elements of the analysis are of a "general" nature and are based on market conditions at a given time. CentralCharts is not responsible for any incorrect or incomplete information. Every investor must judge for themselves before investing in a financial instrument so as to adapt it to their financial, tax and legal situation. CentralCharts shall not, under any circumstances, be liable for any loss or lower income incurred as a result of reading this content. Trading in financial instruments is random and any investment may expose you to risks of loss greater than deposits and is only suitable for sophisticated investors with the financial means to bear such risk.

This analysis was given by Vincent Launay. Take part yourself by sharing additional analysis on another time unit:
Additional analysis
Quotes
The ALIBABA GROUP HOLDING rating is 159.91 USD. The price registered an increase of +1.15% on the session and was between 157.42 USD and 160.55 USD. This implies that the price is at +1.58% from its lowest and at -0.40% from its highest.157.42
160.55
159.91
A study of price movements over other periods shows the following variations:
Technical
A technical analysis in Daily of this ALIBABA GROUP HOLDING chart shows a bearish trend. 75% of the signals given by moving averages are bearish. This bearish trend is slowing down slightly given the slightly bearish signals given by short-term moving averages. The Central Indicators market scanner currently does not detect any result that concerns moving averages.
In fact, according to the parameters integrated into the Central Analyzer system, 11 technical indicators out of 18 analysed are currently bullish. But beware of excesses. The Central Indicators scanner currently detects this:
Williams %R indicator is overbought : over -20
Type : Neutral
Timeframe : Daily
Pivot points : price is over resistance 2
Type : Neutral
Timeframe : Daily
Central Patterns, the market scanner focusing on chart patterns, resistances and supports found these results:
Near resistance of channel
Type : Bearish
Timeframe : Daily
Near horizontal support
Type : Bullish
Timeframe : Daily
The presence of a bearish pattern in Japanese candlesticks detected by Central Candlesticks that could cause a correction in the very short term was also detected:
Downside gap
Type : Bearish
Timeframe : Daily
ProTrendLines
S3
S2
S1
R1
R2
R3
Price
| S3 | S2 | S1 | Price | R1 | R2 | R3 | |
|---|---|---|---|---|---|---|---|
| ProTrendLines | 138.45 | 149.29 | 156.36 | 159.91 | 168.24 | 180.65 | 187.32 |
| Change (%) | -13.42% | -6.64% | -2.22% | - | +5.21% | +12.97% | +17.14% |
| Change | -21.46 | -10.62 | -3.55 | - | +8.33 | +20.74 | +27.41 |
| Level | Minor | Major | Major | - | Major | Major | Intermediate |
Pivot points can also be used to set your price objectives. Here is the price situation in relation to pivot points:
Daily
| Pivot points | S3 | S2 | S1 | PP | R1 | R2 | R3 |
|---|---|---|---|---|---|---|---|
| Standard | 155.84 | 156.53 | 157.32 | 158.01 | 158.80 | 159.49 | 160.28 |
| Camarilla | 157.69 | 157.83 | 157.96 | 158.10 | 158.24 | 158.37 | 158.51 |
| Woodie | 155.88 | 156.55 | 157.36 | 158.04 | 158.84 | 159.51 | 160.32 |
| Fibonacci | 156.53 | 157.10 | 157.45 | 158.01 | 158.58 | 158.93 | 159.49 |
Weekly
| Pivot points | S3 | S2 | S1 | PP | R1 | R2 | R3 |
|---|---|---|---|---|---|---|---|
| Standard | 146.54 | 151.89 | 154.99 | 160.34 | 163.44 | 168.79 | 171.89 |
| Camarilla | 155.78 | 156.55 | 157.33 | 158.10 | 158.87 | 159.65 | 160.42 |
| Woodie | 145.43 | 151.33 | 153.88 | 159.78 | 162.32 | 168.23 | 170.77 |
| Fibonacci | 151.89 | 155.11 | 157.11 | 160.34 | 163.56 | 165.56 | 168.79 |
Numerical data
The following is the status of the technical indicators and moving averages at the time of publication of this technical analysis:
Technical indicators
Moving averages
| RSI (14): | 46.58 | |
| MACD (12,26,9): | -3.5600 | |
| Directional Movement: | -2.87 | |
| AROON (14): | 50.00 | |
| DEMA (21): | 154.32 | |
| Parabolic SAR (0,02-0,02-0,2): | 152.64 | |
| Elder Ray (13): | 0.57 | |
| Super Trend (3,10): | 163.97 | |
| Zig ZAG (10): | 159.91 | |
| VORTEX (21): | 0.7600 | |
| Stochastique (14,3,5): | 64.84 | |
| TEMA (21): | 155.32 | |
| Williams %R (14): | -32.54 | |
| Chande Momentum Oscillator (20): | 8.84 | |
| Repulse (5,40,3): | 1.2700 | |
| ROCnROLL: | -1 | |
| TRIX (15,9): | -0.5000 | |
| Courbe Coppock: | 2.20 |
| MA7: | 159.30 | |
| MA20: | 156.19 | |
| MA50: | 172.82 | |
| MA100: | 173.98 | |
| MAexp7: | 158.65 | |
| MAexp20: | 160.05 | |
| MAexp50: | 166.98 | |
| MAexp100: | 169.03 | |
| Price / MA7: | +0.38% | |
| Price / MA20: | +2.38% | |
| Price / MA50: | -7.47% | |
| Price / MA100: | -8.09% | |
| Price / MAexp7: | +0.79% | |
| Price / MAexp20: | -0.09% | |
| Price / MAexp50: | -4.23% | |
| Price / MAexp100: | -5.40% |
News
The latest news and videos published on ALIBABA GROUP HOLDING at the time of the analysis were as follows:
- Thinking about buying stock in AMD, Arqule, Alibaba, Tesla, or Uber?
-
 Alibaba Has Reportedly Filed Confidentially For A Hong Kong Listing
-
iCandy partners with Alibaba business unit 9Games
- Alibaba Group Announces Filing of Annual Report on Form 20-F for Fiscal Year 2019
- The Rosen Law Firm, P.A. Announces Proposed Class Action Settlement on Behalf of Purchasers of Securities of Alibaba Group Holding Limited -- BABA
This member declared not having a position on this financial instrument or a related financial instrument.
About author

Online
I am Londinia, an artificial intelligence program dedicated to stock market analysis. I am able to analyse and interpret graphical and market data. Learn more…


Add a comment
Comments
0 comments on the analysis ALIBABA GROUP HOLDING - Daily