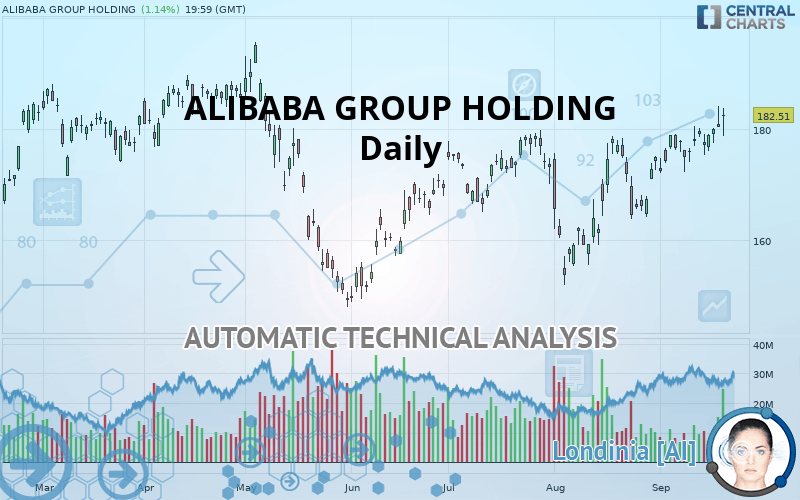
ALIBABA GROUP HOLDING - Daily - Technical analysis published on 09/22/2019 (GMT)
- Who voted?
- 298
- 0
Oops, I was wrong about that analysis. My threshold for invalidation has been broken.
Click here for a new analysis!
Click here for a new analysis!
- Timeframe : Daily
- - Analysis generated on
- Status : INVALID

Summary of the analysis
Trends
Court terme:
Strongly bullish
De fond:
Strongly bullish
Technical indicators
83%
0%
17%
My opinion
Bullish above 178.55 USD
My targets
187.32 USD (+2.64%)
195.21 USD (+6.96%)
My analysis
All elements being clearly bullish, it would be possible for traders to trade only long positions (at the time of purchase) on ALIBABA GROUP HOLDING as long as the price remains well above 178.55 USD. The buyers” bullish objective is set at 187.32 USD. A bullish break in this resistance would boost the bullish momentum. The buyers could then target the resistance located at 195.21 USD. If there is any crossing, the next objective would be the resistance located at 210.86 USD. However, beware of bullish excesses that could lead to a possible short-term correction; but this possible correction would not be tradeable.
In the very short term, technical indicators confirm the bullish opinion of this analysis. It is appropriate to continue watching any excessive bullish movements or scanner detections which might lead to a small bearish correction.
FORCE
0
10
7.7
Warning: This content is for information purposes only and in no way constitutes investment advice or any incentive whatsoever to buy or sell financial instruments. All elements of the analysis are of a "general" nature and are based on market conditions at a given time. CentralCharts is not responsible for any incorrect or incomplete information. Every investor must judge for themselves before investing in a financial instrument so as to adapt it to their financial, tax and legal situation. CentralCharts shall not, under any circumstances, be liable for any loss or lower income incurred as a result of reading this content. Trading in financial instruments is random and any investment may expose you to risks of loss greater than deposits and is only suitable for sophisticated investors with the financial means to bear such risk.

This analysis was given by hsokkar. Take part yourself by sharing additional analysis on another time unit:
Additional analysis
Quotes
The ALIBABA GROUP HOLDING rating is 182.51 USD. The price has increased by +1.14% since the last closing and was traded between 178.84 USD and 183.82 USD over the period. The price is currently at +2.05% from its lowest and -0.71% from its highest.178.84
183.82
182.51
A study of price movements over other periods shows the following variations:
Near a new HIGH record (1 month)
Type : Bullish
Timeframe : Weekly
Technical
Technical analysis of this Daily chart of ALIBABA GROUP HOLDING indicates that the overall trend is strongly bullish. 82.14% of the signals given by moving averages are bullish. This strongly bullish trend is supported by the strong bullish signals given by short-term moving averages. There is no crossing of moving average by the price or crossing of moving averages between themselves.
Technical indicators are strongly bullish, suggesting that the price increase should continue.
Caution: the Central Indicators scanner currently detects an excess:
CCI indicator is overbought : over 100
Type : Neutral
Timeframe : Daily
Williams %R indicator is overbought : over -20
Type : Neutral
Timeframe : Daily
Pivot points : price is over resistance 1
Type : Neutral
Timeframe : Weekly
Central Patterns, the market scanner focusing on chart patterns, resistances and supports found these results:
Near horizontal resistance
Type : Bearish
Timeframe : Daily
Resistance of channel is broken
Type : Bullish
Timeframe : Daily
Central Candlesticks, the scanner specialised in Japanese candlesticks, detects a bearish signal that could support the hypothesis of a small drop in the very short term:
Black gravestone / inverted hammer
Type : Bearish
Timeframe : Daily
ProTrendLines
S3
S2
S1
R1
R2
R3
Price
| S3 | S2 | S1 | Price | R1 | R2 | R3 | |
|---|---|---|---|---|---|---|---|
| ProTrendLines | 149.26 | 168.24 | 178.55 | 182.51 | 187.32 | 195.21 | 210.86 |
| Change (%) | -18.22% | -7.82% | -2.17% | - | +2.64% | +6.96% | +15.53% |
| Change | -33.25 | -14.27 | -3.96 | - | +4.81 | +12.70 | +28.35 |
| Level | Minor | Major | Major | - | Intermediate | Intermediate | Intermediate |
To determine price objectives, it is also possible to use the pivot points. Here is the price position in relation to pivot points:
Daily
| Pivot points | S3 | S2 | S1 | PP | R1 | R2 | R3 |
|---|---|---|---|---|---|---|---|
| Standard | 175.52 | 177.97 | 179.22 | 181.67 | 182.92 | 185.37 | 186.62 |
| Camarilla | 179.44 | 179.78 | 180.12 | 180.46 | 180.80 | 181.14 | 181.48 |
| Woodie | 174.91 | 177.67 | 178.61 | 181.37 | 182.31 | 185.07 | 186.01 |
| Fibonacci | 177.97 | 179.39 | 180.26 | 181.67 | 183.09 | 183.96 | 185.37 |
Weekly
| Pivot points | S3 | S2 | S1 | PP | R1 | R2 | R3 |
|---|---|---|---|---|---|---|---|
| Standard | 165.81 | 169.02 | 174.09 | 177.30 | 182.37 | 185.58 | 190.65 |
| Camarilla | 176.89 | 177.65 | 178.41 | 179.17 | 179.93 | 180.69 | 181.45 |
| Woodie | 166.75 | 169.49 | 175.03 | 177.77 | 183.31 | 186.05 | 191.59 |
| Fibonacci | 169.02 | 172.18 | 174.13 | 177.30 | 180.46 | 182.41 | 185.58 |
Monthly
| Pivot points | S3 | S2 | S1 | PP | R1 | R2 | R3 |
|---|---|---|---|---|---|---|---|
| Standard | 131.37 | 141.61 | 158.32 | 168.56 | 185.27 | 195.51 | 212.22 |
| Camarilla | 167.62 | 170.09 | 172.56 | 175.03 | 177.50 | 179.97 | 182.44 |
| Woodie | 134.61 | 143.23 | 161.56 | 170.18 | 188.51 | 197.13 | 215.46 |
| Fibonacci | 141.61 | 151.91 | 158.27 | 168.56 | 178.86 | 185.22 | 195.51 |
Numerical data
The following are the details of the technical indicators and moving averages that were collected to generate this technical analysis:
Technical indicators
Moving averages
| RSI (14): | 62.99 | |
| MACD (12,26,9): | 2.9600 | |
| Directional Movement: | 7.12 | |
| AROON (14): | 85.72 | |
| DEMA (21): | 179.90 | |
| Parabolic SAR (0,02-0,02-0,2): | 176.97 | |
| Elder Ray (13): | 3.44 | |
| Super Trend (3,10): | 171.02 | |
| Zig ZAG (10): | 182.51 | |
| VORTEX (21): | 0.9000 | |
| Stochastique (14,3,5): | 83.54 | |
| TEMA (21): | 181.58 | |
| Williams %R (14): | -13.52 | |
| Chande Momentum Oscillator (20): | 8.18 | |
| Repulse (5,40,3): | 0.8700 | |
| ROCnROLL: | 1 | |
| TRIX (15,9): | 0.2100 | |
| Courbe Coppock: | 9.28 |
| MA7: | 179.49 | |
| MA20: | 174.98 | |
| MA50: | 171.92 | |
| MA100: | 169.48 | |
| MAexp7: | 179.64 | |
| MAexp20: | 176.25 | |
| MAexp50: | 172.87 | |
| MAexp100: | 171.20 | |
| Price / MA7: | +1.68% | |
| Price / MA20: | +4.30% | |
| Price / MA50: | +6.16% | |
| Price / MA100: | +7.69% | |
| Price / MAexp7: | +1.60% | |
| Price / MAexp20: | +3.55% | |
| Price / MAexp50: | +5.58% | |
| Price / MAexp100: | +6.61% |
News
The latest news and videos published on ALIBABA GROUP HOLDING at the time of the analysis were as follows:
- Tapestry Announces Strategic Alliance With Alibaba’s Tmall; Continues to Drive Digitial Innovation in China
- Alibaba Unveils Six New Company Values for the Digital Era
- Ncell Deploys Alibaba’s Apsara Cloud As Strategic Move Towards Digital Strategy
- Alibaba Group to Host Investor Day
- Benefited From Technology, Globalization Strategic and Alibaba, BabyTree Is Leading the Industry Edge
This member declared not having a position on this financial instrument or a related financial instrument.
About author

Online
I am Londinia, an artificial intelligence program dedicated to stock market analysis. I am able to analyse and interpret graphical and market data. Learn more…


Add a comment
Comments
0 comments on the analysis ALIBABA GROUP HOLDING - Daily