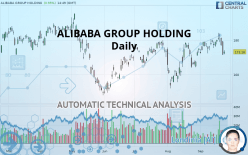
ALIBABA GROUP HOLDING - Daily - Technical analysis published on 09/25/2019 (GMT)
- Who voted?
- 254
- 0
- Timeframe : Daily
- - Analysis generated on
- Status : NEUTRAL

Summary of the analysis

Additional analysis
Quotes
The ALIBABA GROUP HOLDING rating is 173.18 USD. The price has increased by +0.95% since the last closing and was traded between 171.72 USD and 174.04 USD over the period. The price is currently at +0.85% from its lowest and -0.49% from its highest.A bullish opening was detected by the Central Gaps scanner. Buyers are trying to impose a bullish momentum in the very short term.
Bullish opening
Type : Bullish
Timeframe : Openning
A study of price movements over other periods shows the following variations:
Near a new LOW record (1 month)
Type : Bearish
Timeframe : Weekly
Technical
Technical analysis of this Daily chart of ALIBABA GROUP HOLDING indicates that the overall trend is slightly bullish. 57.14% of the signals given by moving averages are bullish. As the signals currently given by short-term moving averages are rather neutral, the overall trend could quickly return to neutral as well. The Central Indicators market scanner is currently detecting several bearish signals that could impact this trend:
Bearish trend reversal : Moving Average 50
Type : Bearish
Timeframe : Daily
Bearish trend reversal : adaptative moving average 20
Type : Bearish
Timeframe : Daily
Bearish trend reversal : adaptative moving average 50
Type : Bearish
Timeframe : Daily
Bearish price crossover with Moving Average 20
Type : Bearish
Timeframe : Daily
Bearish price crossover with Moving Average 50
Type : Bearish
Timeframe : Daily
Bearish price crossover with adaptative moving average 20
Type : Bearish
Timeframe : Daily
Bearish price crossover with adaptative moving average 100
Type : Bearish
Timeframe : Daily
In fact, only 8 technical indicators out of 18 studied are currently positioned bearish. Caution: the Central Indicators scanner currently detects an excess:
Williams %R indicator is oversold : under -80
Type : Neutral
Timeframe : Daily
Pivot points : price is under support 1
Type : Neutral
Timeframe : Weekly
RSI indicator is back under 50
Type : Bearish
Timeframe : Daily
MACD crosses DOWN its Moving Average
Type : Bearish
Timeframe : Daily
Price is back over the pivot point
Type : Bullish
Timeframe : Weekly
Price is back under the pivot point
Type : Bearish
Timeframe : Daily
Central Patterns, the market scanner focusing on chart patterns, resistances and supports found these results:
Resistance of channel is broken
Type : Bullish
Timeframe : Daily
Horizontal support is broken
Type : Bearish
Timeframe : Daily
The Central Candlesticks scanner, specialised in Japanese candlesticks, did not identify any signals.
| S3 | S2 | S1 | Price | R1 | R2 | R3 | |
|---|---|---|---|---|---|---|---|
| ProTrendLines | 139.09 | 149.26 | 168.24 | 173.18 | 178.55 | 187.32 | 195.21 |
| Change (%) | -19.68% | -13.81% | -2.85% | - | +3.10% | +8.16% | +12.72% |
| Change | -34.09 | -23.92 | -4.94 | - | +5.37 | +14.14 | +22.03 |
| Level | Minor | Major | Major | - | Major | Minor | Intermediate |
Pivot points can also be used to set your price objectives. Here is the price situation in relation to pivot points:
| Pivot points | S3 | S2 | S1 | PP | R1 | R2 | R3 |
|---|---|---|---|---|---|---|---|
| Standard | 160.55 | 165.92 | 168.74 | 174.11 | 176.93 | 182.30 | 185.12 |
| Camarilla | 169.30 | 170.05 | 170.80 | 171.55 | 172.30 | 173.05 | 173.80 |
| Woodie | 159.27 | 165.28 | 167.46 | 173.47 | 175.65 | 181.66 | 183.84 |
| Fibonacci | 165.92 | 169.05 | 170.99 | 174.11 | 177.24 | 179.18 | 182.30 |
| Pivot points | S3 | S2 | S1 | PP | R1 | R2 | R3 |
|---|---|---|---|---|---|---|---|
| Standard | 168.45 | 171.91 | 177.21 | 180.67 | 185.97 | 189.43 | 194.73 |
| Camarilla | 180.10 | 180.90 | 181.71 | 182.51 | 183.31 | 184.12 | 184.92 |
| Woodie | 169.37 | 172.37 | 178.13 | 181.13 | 186.89 | 189.89 | 195.65 |
| Fibonacci | 171.91 | 175.26 | 177.32 | 180.67 | 184.02 | 186.08 | 189.43 |
| Pivot points | S3 | S2 | S1 | PP | R1 | R2 | R3 |
|---|---|---|---|---|---|---|---|
| Standard | 131.37 | 141.61 | 158.32 | 168.56 | 185.27 | 195.51 | 212.22 |
| Camarilla | 167.62 | 170.09 | 172.56 | 175.03 | 177.50 | 179.97 | 182.44 |
| Woodie | 134.61 | 143.23 | 161.56 | 170.18 | 188.51 | 197.13 | 215.46 |
| Fibonacci | 141.61 | 151.91 | 158.27 | 168.56 | 178.86 | 185.22 | 195.51 |
Numerical data
The following is the status of the technical indicators and moving averages at the time of publication of this technical analysis:
| RSI (14): | 47.58 | |
| MACD (12,26,9): | 1.4900 | |
| Directional Movement: | -6.10 | |
| AROON (14): | -21.43 | |
| DEMA (21): | 177.83 | |
| Parabolic SAR (0,02-0,02-0,2): | 183.48 | |
| Elder Ray (13): | -3.44 | |
| Super Trend (3,10): | 171.02 | |
| Zig ZAG (10): | 173.04 | |
| VORTEX (21): | 0.9300 | |
| Stochastique (14,3,5): | 18.57 | |
| TEMA (21): | 177.93 | |
| Williams %R (14): | -86.13 | |
| Chande Momentum Oscillator (20): | -4.70 | |
| Repulse (5,40,3): | -4.7400 | |
| ROCnROLL: | -1 | |
| TRIX (15,9): | 0.2000 | |
| Courbe Coppock: | 3.55 |
| MA7: | 177.55 | |
| MA20: | 176.23 | |
| MA50: | 172.02 | |
| MA100: | 168.94 | |
| MAexp7: | 175.93 | |
| MAexp20: | 175.61 | |
| MAexp50: | 172.98 | |
| MAexp100: | 171.40 | |
| Price / MA7: | -2.46% | |
| Price / MA20: | -1.73% | |
| Price / MA50: | +0.67% | |
| Price / MA100: | +2.51% | |
| Price / MAexp7: | -1.56% | |
| Price / MAexp20: | -1.38% | |
| Price / MAexp50: | +0.12% | |
| Price / MAexp100: | +1.04% |
News
The last news published on ALIBABA GROUP HOLDING at the time of the generation of this analysis was as follows:
- Alibaba Cloud Spurs Industry Innovation for China Gateway Customers
- Avnet Expands E-commerce Strategy in China with Alibaba
- Alibaba Unveils Five-Year Goals for China Consumer Business
- Alibaba Group Receives 33% Equity Interest in Ant Financial
- Tapestry Announces Strategic Alliance With Alibaba’s Tmall; Continues to Drive Digitial Innovation in China
About author

Online


Add a comment
Comments
0 comments on the analysis ALIBABA GROUP HOLDING - Daily