US DOLLAR INDEX - U.S. Dollar Index Printed 5 Bullish Days - 02/15/2017 (GMT)
- Who voted?
- 495
- 0
- Timeframe : 4H
US DOLLAR INDEX Chart
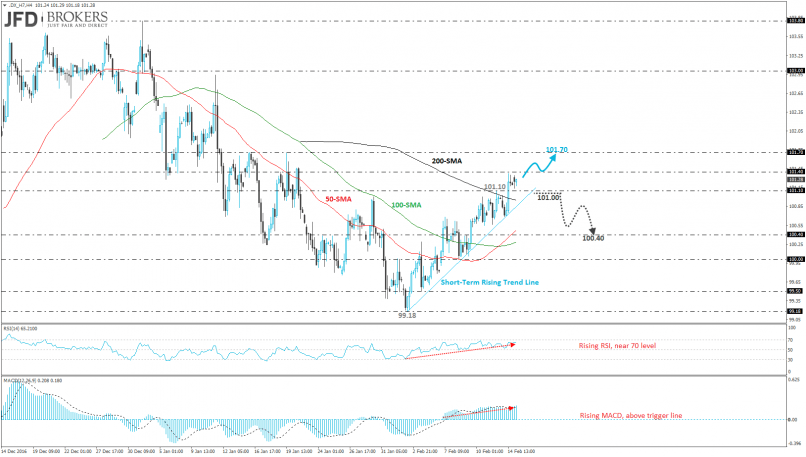
The U.S. Dollar Index (.DX_H7) surged 1.8% this month and during yesterday’s session it recorded the fifth consecutive green day. The index printed an almost one-month fresh high at 101.37 and met the 50-daily SMA. Since 2nd of February, the price is moving in an ascending move following the bounce off the 99.18 support barrier, as the Fed Chair Yellen’s testimony helped it to move higher. Moreover, the next immediate resistance obstacle to watch for further upside movement is the 101.70 barrier.
In the case, of a drop below the rising trend line, it will open the door for a retest of the 100.40 support level which overlaps with the 50-SMA on the 4-hour chart. The three SMAs seem to be in agreement with the bullish thought as well as, the technical indicators. RSI is approaching the overbought area and the 70 level while MACD climbed above its trigger line and is following a positive area.
In the case, of a drop below the rising trend line, it will open the door for a retest of the 100.40 support level which overlaps with the 50-SMA on the 4-hour chart. The three SMAs seem to be in agreement with the bullish thought as well as, the technical indicators. RSI is approaching the overbought area and the 70 level while MACD climbed above its trigger line and is following a positive area.
This member did not declare if he had a position on this financial instrument or a related financial instrument.
About author

Offline


Add a comment
Comments
0 comments on the analysis US DOLLAR INDEX - 4H