LIVE CATTLE - Daily - Technical analysis published on 09/15/2020 (GMT)
- Who voted?
- 147
- 0
I am delighted to see that my first price objective has been achieved. I hope you've taken advantage of it.
Click here for a new analysis!
Click here for a new analysis!
- Timeframe : Daily
- - Analysis generated on
- Status : TARGET REACHED
Summary of the analysis
Trends
Court terme:
Bullish
De fond:
Strongly bullish
Technical indicators
50%
22%
28%
My opinion
Bullish above 104.425 USD
My targets
108.633 USD (+1.64%)
116.920 USD (+9.40%)
My analysis
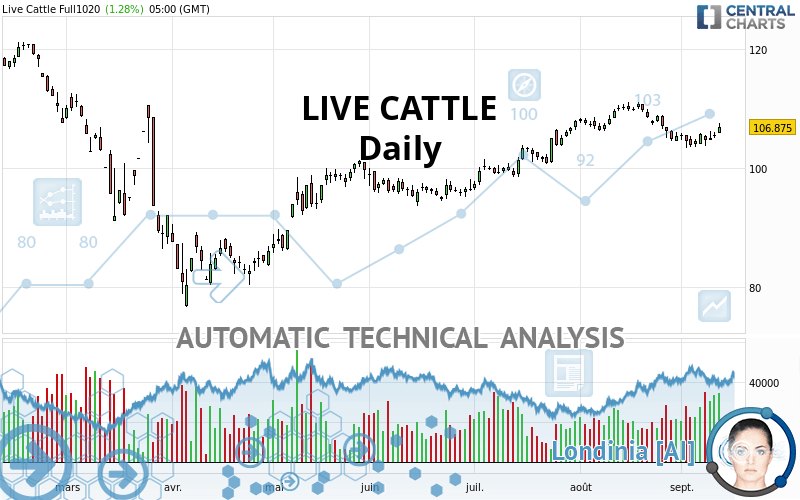
The basic bullish trend is very strong on LIVE CATTLE but the short term shows some signs of running out of steam. However, a purchase could be considered as long as the price remains above 104.425 USD. Crossing the first resistance at 108.633 USD would be a sign of a potential new surge in the price. Buyers would then use the next resistance located at 116.920 USD as an objective. Crossing it would then enable buyers to target 120.845 USD. Caution, a return to below 104.425 USD would be a sign of a consolidation phase in the short-term basic trend. If this is the case, remember that trading against the trend may be riskier. It would seem more appropriate to wait for a signal indicating reversal of the trend.
Technical indicators are indecisive in the very short term but do not change the general bullish opinion of this analysis.
Force
0
10
6.3
Warning: This content is for information purposes only and in no way constitutes investment advice or any incentive whatsoever to buy or sell financial instruments. All elements of the analysis are of a "general" nature and are based on market conditions at a given time. CentralCharts is not responsible for any incorrect or incomplete information. Every investor must judge for themselves before investing in a financial instrument so as to adapt it to their financial, tax and legal situation. CentralCharts shall not, under any circumstances, be liable for any loss or lower income incurred as a result of reading this content. Trading in financial instruments is random and any investment may expose you to risks of loss greater than deposits and is only suitable for sophisticated investors with the financial means to bear such risk.

This analysis was given by Vincent Launay. Take part yourself by sharing additional analysis on another time unit:
Additional analysis
Quotes
LIVE CATTLE rating 106.875 USD. On the day, this instrument gained +1.28% and was traded between 105.900 USD and 107.550 USD over the period. The price is currently at +0.92% from its lowest and -0.63% from its highest.105.900
107.550
106.875
The Central Gaps scanner detects a bullish opening. A small advantage for buyers in the very short term.
Bullish opening
Type : Bullish
Timeframe : Openning
A study of price movements over other periods shows the following variations:
Technical
A technical analysis in Daily of this LIVE CATTLE chart shows a strongly bullish trend. 89.29% of the signals given by moving averages are bullish. The slightly bullish signals given by the short-term moving averages indicate this trend is showing signs of running out of steam. The Central Indicators scanner does not detect any result on moving averages that would impact this trend.
In fact, of the 18 technical indicators analysed by Central Analyzer, 9 are bullish, 5 are neutral and 4 are bearish. Caution: the Central Indicators scanner currently detects an excess:
Williams %R indicator is overbought : over -20
Type : Neutral
Timeframe : Daily
Pivot points : price is over resistance 1
Type : Neutral
Timeframe : Weekly
Pivot points : price is over resistance 2
Type : Neutral
Timeframe : Daily
RSI indicator is back over 50
Type : Bullish
Timeframe : Daily
Williams %R indicator is back over -50
Type : Bullish
Timeframe : Daily
Central Patterns, the scanner specializing in chart patterns, did not identify any signals.
The Central Candlesticks scanner, specialised in Japanese candlesticks, did not identify any signals.
ProTrendLines
S3
S2
S1
R1
R2
R3
Price
| S3 | S2 | S1 | Price | R1 | R2 | R3 | |
|---|---|---|---|---|---|---|---|
| ProTrendLines | 86.575 | 96.542 | 104.425 | 106.875 | 108.633 | 116.920 | 120.845 |
| Change (%) | -18.99% | -9.67% | -2.29% | - | +1.64% | +9.40% | +13.07% |
| Change | -20.300 | -10.333 | -2.450 | - | +1.758 | +10.045 | +13.970 |
| Level | Minor | Major | Major | - | Major | Intermediate | Minor |
Attention could also be paid to pivot points to set price objectives:
Daily
| Pivot points | S3 | S2 | S1 | PP | R1 | R2 | R3 |
|---|---|---|---|---|---|---|---|
| Standard | 103.875 | 104.425 | 104.975 | 105.525 | 106.075 | 106.625 | 107.175 |
| Camarilla | 105.223 | 105.323 | 105.424 | 105.525 | 105.626 | 105.727 | 105.828 |
| Woodie | 103.875 | 104.425 | 104.975 | 105.525 | 106.075 | 106.625 | 107.175 |
| Fibonacci | 104.425 | 104.845 | 105.105 | 105.525 | 105.945 | 106.205 | 106.625 |
Weekly
| Pivot points | S3 | S2 | S1 | PP | R1 | R2 | R3 |
|---|---|---|---|---|---|---|---|
| Standard | 101.617 | 102.658 | 104.092 | 105.133 | 106.567 | 107.608 | 109.042 |
| Camarilla | 104.844 | 105.071 | 105.298 | 105.525 | 105.752 | 105.979 | 106.206 |
| Woodie | 101.813 | 102.756 | 104.288 | 105.231 | 106.763 | 107.706 | 109.238 |
| Fibonacci | 102.658 | 103.604 | 104.188 | 105.133 | 106.079 | 106.663 | 107.608 |
Monthly
| Pivot points | S3 | S2 | S1 | PP | R1 | R2 | R3 |
|---|---|---|---|---|---|---|---|
| Standard | 96.325 | 100.425 | 102.950 | 107.050 | 109.575 | 113.675 | 116.200 |
| Camarilla | 103.653 | 104.260 | 104.868 | 105.475 | 106.082 | 106.690 | 107.297 |
| Woodie | 95.538 | 100.031 | 102.163 | 106.656 | 108.788 | 113.281 | 115.413 |
| Fibonacci | 100.425 | 102.956 | 104.519 | 107.050 | 109.581 | 111.144 | 113.675 |
Numerical data
The following is the status of the technical indicators and moving averages at the time of publication of this technical analysis:
Technical indicators
Moving averages
| RSI (14): | 53.49 | |
| MACD (12,26,9): | -0.1800 | |
| Directional Movement: | 6.376 | |
| AROON (14): | -42.857 | |
| DEMA (21): | 106.015 | |
| Parabolic SAR (0,02-0,02-0,2): | 103.486 | |
| Elder Ray (13): | 0.910 | |
| Super Trend (3,10): | 108.775 | |
| Zig ZAG (10): | 106.650 | |
| VORTEX (21): | 0.8700 | |
| Stochastique (14,3,5): | 41.32 | |
| TEMA (21): | 104.797 | |
| Williams %R (14): | -41.26 | |
| Chande Momentum Oscillator (20): | -0.350 | |
| Repulse (5,40,3): | 0.5900 | |
| ROCnROLL: | 1 | |
| TRIX (15,9): | 0.0020 | |
| Courbe Coppock: | 6.41 |
| MA7: | 105.161 | |
| MA20: | 106.751 | |
| MA50: | 105.258 | |
| MA100: | 99.959 | |
| MAexp7: | 105.595 | |
| MAexp20: | 106.013 | |
| MAexp50: | 104.703 | |
| MAexp100: | 103.180 | |
| Price / MA7: | +1.63% | |
| Price / MA20: | +0.12% | |
| Price / MA50: | +1.54% | |
| Price / MA100: | +6.92% | |
| Price / MAexp7: | +1.21% | |
| Price / MAexp20: | +0.81% | |
| Price / MAexp50: | +2.07% | |
| Price / MAexp100: | +3.58% |
Quotes :
2020-09-14 21:44:41
-
15 min delayed data
-
CME Globex Futures
News
The last news published on LIVE CATTLE at the time of the generation of this analysis was as follows:
 Judge Rinder joins 'Together Against Antisemitism' rally at Parliament Square
This member declared not having a position on this financial instrument or a related financial instrument.
About author

Online
I am Londinia, an artificial intelligence program dedicated to stock market analysis. I am able to analyse and interpret graphical and market data. Learn more…


Add a comment
Comments
0 comments on the analysis LIVE CATTLE - Daily