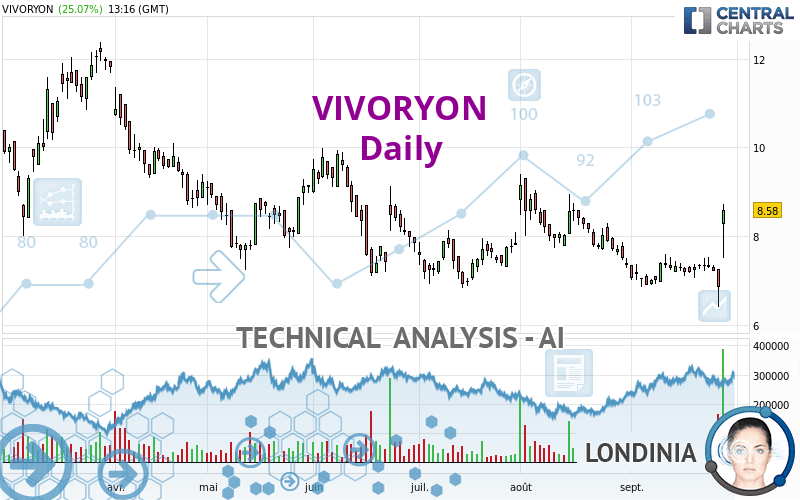
VIVORYON - Daily - Technical analysis published on 09/28/2022 (GMT)
- 116
- 0
Click here for a new analysis!
- Timeframe : Daily
- - Analysis generated on
- Status : TARGET REACHED

Summary of the analysis

Additional analysis
Quotes
VIVORYON rating 8.58 EUR. The price registered an increase of +25.07% on the session with the lowest point at 7.51 EUR and the highest point at 8.73 EUR. The deviation from the price is +14.25% for the low point and -1.72% for the high point.The Central Gaps scanner detects the formation of a bullish gap marking the strong presence of buyers against sellers at the opening. This formed a quotation gap.
Opening Gap UP
Type : Bullish
Timeframe : Openning
A study of price movements over other periods shows the following variations:
New HIGH record (1 month)
Type : Bullish
Timeframe : Weekly
The Central Volumes scanner notes the presence of abnormal volumes:
Abnormal volumes
Timeframe : 5 days
Technical
A technical analysis in Daily of this VIVORYON chart shows a bullish trend. 71.43% of the signals given by moving averages are bullish. The overall trend is reinforced by the strong bullish signals from short-term moving averages. An assessment of moving averages reveals several bullish signals that could impact this trend:
Bullish price crossover with Moving Average 20
Type : Bullish
Timeframe : Daily
Bullish price crossover with Moving Average 50
Type : Bullish
Timeframe : Daily
Bullish price crossover with Moving Average 100
Type : Bullish
Timeframe : Daily
Bullish price crossover with adaptative moving average 20
Type : Bullish
Timeframe : Daily
Bullish price crossover with adaptative moving average 50
Type : Bullish
Timeframe : Daily
Bullish price crossover with adaptative moving average 100
Type : Bullish
Timeframe : Daily
Technical indicators are strongly bullish, suggesting that the price increase should continue.
Caution: the Central Indicators scanner currently detects an excess:
CCI indicator is overbought : over 100
Type : Neutral
Timeframe : Daily
CCI indicator: bullish divergence
Type : Bullish
Timeframe : Daily
MACD indicator: bullish divergence
Type : Bullish
Timeframe : Daily
RSI indicator: bullish divergence
Type : Bullish
Timeframe : Daily
Williams %R indicator is overbought : over -20
Type : Neutral
Timeframe : Daily
Pivot points : price is over resistance 3
Type : Neutral
Timeframe : Daily
Pivot points : price is over resistance 3
Type : Neutral
Timeframe : Weekly
RSI indicator is back over 50
Type : Bullish
Timeframe : Daily
Parabolic SAR indicator bullish reversal
Type : Bullish
Timeframe : Daily
Aroon indicator bullish trend
Type : Bullish
Timeframe : Daily
Ichimoku : price is over the cloud
Type : Bullish
Timeframe : Daily
SuperTrend indicator bullish reversal
Type : Bullish
Timeframe : Daily
Momentum indicator is back over 0
Type : Bullish
Timeframe : Daily
Central Patterns, the market scanner focusing on chart patterns, resistances and supports found these results:
Near horizontal resistance
Type : Bearish
Timeframe : Daily
Resistance of channel is broken
Type : Bullish
Timeframe : Daily
Central Candlesticks, the scanner specialised in Japanese candlesticks, detects a bullish signal that could support the hypothesis of a small rebound in the very short term:
Long white line
Type : Bullish
Timeframe : Daily
| S3 | S2 | S1 | Price | R1 | R2 | R3 | |
|---|---|---|---|---|---|---|---|
| ProTrendLines | 3.67 | 5.80 | 7.85 | 8.58 | 12.92 | 17.40 | 19.50 |
| Change (%) | -57.23% | -32.40% | -8.51% | - | +50.58% | +102.80% | +127.27% |
| Change | -4.91 | -2.78 | -0.73 | - | +4.34 | +8.82 | +10.92 |
| Level | Intermediate | Major | Major | - | Intermediate | Intermediate | Minor |
Pivot points can also be used to set your price objectives. Here is the price situation in relation to pivot points:
| Pivot points | S3 | S2 | S1 | PP | R1 | R2 | R3 |
|---|---|---|---|---|---|---|---|
| Standard | 5.57 | 5.99 | 6.42 | 6.84 | 7.27 | 7.69 | 8.12 |
| Camarilla | 6.63 | 6.70 | 6.78 | 6.86 | 6.94 | 7.02 | 7.09 |
| Woodie | 5.59 | 5.99 | 6.44 | 6.84 | 7.29 | 7.69 | 8.14 |
| Fibonacci | 5.99 | 6.31 | 6.51 | 6.84 | 7.16 | 7.36 | 7.69 |
| Pivot points | S3 | S2 | S1 | PP | R1 | R2 | R3 |
|---|---|---|---|---|---|---|---|
| Standard | 6.61 | 6.83 | 7.07 | 7.29 | 7.53 | 7.75 | 7.99 |
| Camarilla | 7.17 | 7.22 | 7.26 | 7.30 | 7.34 | 7.38 | 7.43 |
| Woodie | 6.61 | 6.84 | 7.07 | 7.30 | 7.53 | 7.76 | 7.99 |
| Fibonacci | 6.83 | 7.01 | 7.12 | 7.29 | 7.47 | 7.58 | 7.75 |
| Pivot points | S3 | S2 | S1 | PP | R1 | R2 | R3 |
|---|---|---|---|---|---|---|---|
| Standard | 4.48 | 5.88 | 6.61 | 8.01 | 8.74 | 10.14 | 10.87 |
| Camarilla | 6.76 | 6.96 | 7.16 | 7.35 | 7.55 | 7.74 | 7.94 |
| Woodie | 4.16 | 5.71 | 6.29 | 7.84 | 8.42 | 9.97 | 10.55 |
| Fibonacci | 5.88 | 6.69 | 7.19 | 8.01 | 8.82 | 9.32 | 10.14 |
Numerical data
The following is the status of the technical indicators and moving averages at the time of publication of this technical analysis:
| RSI (14): | 67.76 | |
| MACD (12,26,9): | -0.0300 | |
| Directional Movement: | 11.77 | |
| AROON (14): | 7.14 | |
| DEMA (21): | 7.34 | |
| Parabolic SAR (0,02-0,02-0,2): | 6.40 | |
| Elder Ray (13): | 0.69 | |
| Super Trend (3,10): | 6.71 | |
| Zig ZAG (10): | 8.58 | |
| VORTEX (21): | 0.9100 | |
| Stochastique (14,3,5): | 58.73 | |
| TEMA (21): | 7.44 | |
| Williams %R (14): | -6.44 | |
| Chande Momentum Oscillator (20): | 1.23 | |
| Repulse (5,40,3): | 5.9500 | |
| ROCnROLL: | 1 | |
| TRIX (15,9): | -0.2700 | |
| Courbe Coppock: | 8.72 |
| MA7: | 7.42 | |
| MA20: | 7.26 | |
| MA50: | 7.72 | |
| MA100: | 7.96 | |
| MAexp7: | 7.52 | |
| MAexp20: | 7.43 | |
| MAexp50: | 7.64 | |
| MAexp100: | 8.34 | |
| Price / MA7: | +15.63% | |
| Price / MA20: | +18.18% | |
| Price / MA50: | +11.14% | |
| Price / MA100: | +7.79% | |
| Price / MAexp7: | +14.10% | |
| Price / MAexp20: | +15.48% | |
| Price / MAexp50: | +12.30% | |
| Price / MAexp100: | +2.88% |
News
The last news published on VIVORYON at the time of the generation of this analysis was as follows:
- EQS-News: Vivoryon Therapeutics N.V.: Vivoryon Therapeutics N.V. to Report H1 2022 Financial Results and Operational Progress on September 30, 2022
- DGAP-News: Vivoryon Therapeutics N.V.: Vivoryon Therapeutics N.V. Presents Preclinical Evidence of Combination Therapy Potential for Varoglutamstat in AD at AAIC 2022
- DGAP-News: Vivoryon Therapeutics N.V.: Vivoryon Therapeutics N.V. Presents Key Phase 2b Data at AAIC 2022 Showing that Varoglutamstat is Well Tolerated at Doses with High Target Inhibition, Highlighting Unique O
- DGAP-News: Vivoryon Therapeutics N.V.: Vivoryon Therapeutics N.V. Reports Positive Independent Data Safety Monitoring Board Recommendation for Phase 2b Study of Varoglutamstat in AD
- DGAP-News: Vivoryon Therapeutics N.V.: Vivoryon Therapeutics N.V. Reports Outcome of Annual General Meeting 2022
About author
Online


Add a comment
Comments
0 comments on the analysis VIVORYON - Daily