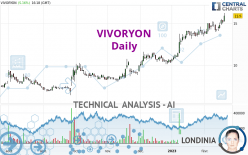
VIVORYON - Daily - Technical analysis published on 02/20/2023 (GMT)
- 136
- 0
Click here for a new analysis!
- Timeframe : Daily
- - Analysis generated on
- Status : INVALID

Summary of the analysis

Additional analysis
Quotes
The VIVORYON rating is 15.90 EUR. The price has increased by +5.16% since the last closing and was traded between 15.24 EUR and 16.24 EUR over the period. The price is currently at +4.33% from its lowest and -2.09% from its highest.The Central Gaps scanner detects a bullish opening. A small advantage for buyers in the very short term.
Bullish opening
Type : Bullish
Timeframe : Openning
Here is a more detailed summary of the historical variations registered by VIVORYON:
New HIGH record (1 year)
Type : Bullish
Timeframe : Weekly
New HIGH record (1st january)
Type : Bullish
Timeframe : Weekly
New HIGH record (1 month)
Type : Bullish
Timeframe : Weekly
Technical
A technical analysis in Daily of this VIVORYON chart shows a strongly bullish trend. The signals given by the moving averages are 92.86% bullish. This strong bullish trend is confirmed by the strong signals currently being given by short-term moving averages. The Central Indicators scanner does not detect any result on moving averages that would impact this trend.
The probability of a further increase is high given the direction of the technical indicators.
But beware of excesses. The Central Indicators scanner currently detects this:
RSI indicator is overbought : over 70
Type : Neutral
Timeframe : Daily
CCI indicator is overbought : over 100
Type : Neutral
Timeframe : Daily
Williams %R indicator is overbought : over -20
Type : Neutral
Timeframe : Daily
Pivot points : price is over resistance 1
Type : Neutral
Timeframe : Weekly
Pivot points : price is over resistance 3
Type : Neutral
Timeframe : Daily
MACD crosses UP its Moving Average
Type : Bullish
Timeframe : Daily
The Central Patterns scanner, which studies chart patterns, resistances and supports, has identified these signals:
Near horizontal resistance
Type : Bearish
Timeframe : Daily
Resistance of channel is broken
Type : Bullish
Timeframe : Daily
The Central Candlesticks scanner, specialised in Japanese candlesticks, did not identify any signals.
| S3 | S2 | S1 | Price | R1 | R2 | R3 | |
|---|---|---|---|---|---|---|---|
| ProTrendLines | 12.92 | 14.16 | 15.10 | 15.90 | 17.49 | 20.40 | 22.47 |
| Change (%) | -18.74% | -10.94% | -5.03% | - | +10.00% | +28.30% | +41.32% |
| Change | -2.98 | -1.74 | -0.80 | - | +1.59 | +4.50 | +6.57 |
| Level | Intermediate | Major | Major | - | Major | Minor | Major |
Pivot points can also be used to set your price objectives. Here is the price situation in relation to pivot points:
| Pivot points | S3 | S2 | S1 | PP | R1 | R2 | R3 |
|---|---|---|---|---|---|---|---|
| Standard | 14.51 | 14.75 | 14.93 | 15.17 | 15.35 | 15.59 | 15.77 |
| Camarilla | 15.01 | 15.04 | 15.08 | 15.12 | 15.16 | 15.20 | 15.24 |
| Woodie | 14.49 | 14.74 | 14.91 | 15.16 | 15.33 | 15.58 | 15.75 |
| Fibonacci | 14.75 | 14.91 | 15.01 | 15.17 | 15.33 | 15.43 | 15.59 |
| Pivot points | S3 | S2 | S1 | PP | R1 | R2 | R3 |
|---|---|---|---|---|---|---|---|
| Standard | 12.79 | 13.41 | 14.27 | 14.89 | 15.75 | 16.37 | 17.23 |
| Camarilla | 14.71 | 14.85 | 14.98 | 15.12 | 15.26 | 15.39 | 15.53 |
| Woodie | 12.90 | 13.47 | 14.38 | 14.95 | 15.86 | 16.43 | 17.34 |
| Fibonacci | 13.41 | 13.98 | 14.33 | 14.89 | 15.46 | 15.81 | 16.37 |
| Pivot points | S3 | S2 | S1 | PP | R1 | R2 | R3 |
|---|---|---|---|---|---|---|---|
| Standard | 6.91 | 8.61 | 11.21 | 12.91 | 15.51 | 17.21 | 19.81 |
| Camarilla | 12.62 | 13.01 | 13.41 | 13.80 | 14.19 | 14.59 | 14.98 |
| Woodie | 7.35 | 8.84 | 11.65 | 13.14 | 15.95 | 17.44 | 20.25 |
| Fibonacci | 8.61 | 10.26 | 11.27 | 12.91 | 14.56 | 15.57 | 17.21 |
Numerical data
The following are the details of the technical indicators and moving averages that were collected to generate this technical analysis:
| RSI (14): | 71.09 | |
| MACD (12,26,9): | 0.6700 | |
| Directional Movement: | 27.90 | |
| AROON (14): | 100.00 | |
| DEMA (21): | 15.34 | |
| Parabolic SAR (0,02-0,02-0,2): | 14.04 | |
| Elder Ray (13): | 0.97 | |
| Super Trend (3,10): | 13.72 | |
| Zig ZAG (10): | 15.90 | |
| VORTEX (21): | 1.1100 | |
| Stochastique (14,3,5): | 86.66 | |
| TEMA (21): | 15.34 | |
| Williams %R (14): | -14.06 | |
| Chande Momentum Oscillator (20): | 1.84 | |
| Repulse (5,40,3): | 4.7500 | |
| ROCnROLL: | 1 | |
| TRIX (15,9): | 0.7100 | |
| Courbe Coppock: | 15.01 |
| MA7: | 14.88 | |
| MA20: | 14.43 | |
| MA50: | 12.86 | |
| MA100: | 11.02 | |
| MAexp7: | 15.09 | |
| MAexp20: | 14.43 | |
| MAexp50: | 13.10 | |
| MAexp100: | 11.69 | |
| Price / MA7: | +6.85% | |
| Price / MA20: | +10.19% | |
| Price / MA50: | +23.64% | |
| Price / MA100: | +44.28% | |
| Price / MAexp7: | +5.37% | |
| Price / MAexp20: | +10.19% | |
| Price / MAexp50: | +21.37% | |
| Price / MAexp100: | +36.01% |
News
The last news published on VIVORYON at the time of the generation of this analysis was as follows:
- Vivoryon Therapeutics N.V. to Present at the 2023 BIO CEO & Investor Conference
- EQS-News: Vivoryon Therapeutics N.V.: Vivoryon Therapeutics to Present a Clinical Update on its Novel Oral Small Molecule Varoglutamstat at Clinical Trials on Alzheimer's Disease Conference (CTAD)
- EQS-News: Vivoryon Therapeutics N.V.: Vivoryon Therapeutics Announces Successful Listing of 2,054,796 Shares
- EQS-News: Vivoryon Therapeutics N.V.: Vivoryon Therapeutics N.V. Reports Third Quarter 2022 Financial Results and Highlights Operational Progress
- EQS-News: Vivoryon Therapeutics N.V.: Vivoryon Therapeutics N.V. to Report Q3 2022 Financial Results and Operational Progress on November 22, 2022
About author
Online


Add a comment
Comments
0 comments on the analysis VIVORYON - Daily