SPARK THERAPEUTICS INC. - Daily - Technical analysis published on 07/18/2019 (GMT)
- Who voted?
- 134
- 0
I am pleased to note that the threshold for invalidation has been maintained for 20 Candlesticks.
Click here for a new analysis!
Click here for a new analysis!
- Timeframe : Daily
- - Analysis generated on
- Status : LEVEL MAINTAINED

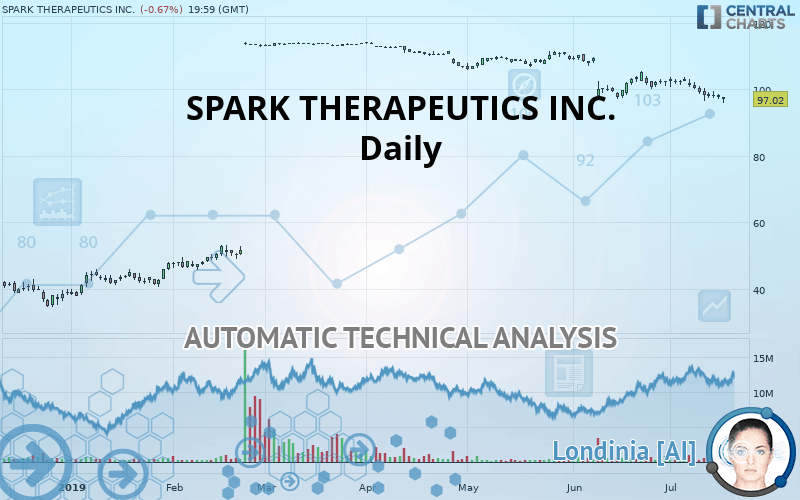
SPARK THERAPEUTICS INC. Chart
Summary of the analysis
Trends
Court terme:
Strongly bearish
De fond:
Bearish
Technical indicators
17%
56%
28%
My opinion
Bearish under 106.05 USD
My targets
92.39 USD (-4.77%)
64.75 USD (-33.26%)
My analysis
In the short term, we can see an acceleration in the bearish trend on SPARK THERAPEUTICS INC., which is a positive signal for sellers. As long as the price remains above 106.05 USD, a sale could be considered. The first bearish objective is located at 92.39 USD. The bearish momentum would be revived by a break in this support. Sellers would then use the next support located at 64.75 USD as an objective. Crossing it would then enable sellers to target 44.77 USD. If the price were to return above 106.05 USD, it would probably only trigger a small rebound in the short term to give a better base for restarting. Trading this rebound may be risky.
Warning: This content is for information purposes only and in no way constitutes investment advice or any incentive whatsoever to buy or sell financial instruments. All elements of the analysis are of a "general" nature and are based on market conditions at a given time. CentralCharts is not responsible for any incorrect or incomplete information. Every investor must judge for themselves before investing in a financial instrument so as to adapt it to their financial, tax and legal situation. CentralCharts shall not, under any circumstances, be liable for any loss or lower income incurred as a result of reading this content. Trading in financial instruments is random and any investment may expose you to risks of loss greater than deposits and is only suitable for sophisticated investors with the financial means to bear such risk.
This analysis was given by Vincent Launay.
Additional analysis
Quotes
The SPARK THERAPEUTICS INC. rating is 97.02 USD. The price registered a decrease of -0.67% on the session with the lowest point at 95.96 USD and the highest point at 97.70 USD. The deviation from the price is +1.10% for the low point and -0.70% for the high point.95.96
97.70
97.02
The Central Gaps scanner detects a bullish opening marking the presence of sellers ahead of buyers at the opening but not sufficiently marked to allow the price to register a quotation gap.
Bearish opening
Type : Bearish
Timeframe : Openning
So that you have an overall view of the price change, here is a table showing the variations over several periods:
Technical
Technical analysis of this Daily chart of SPARK THERAPEUTICS INC. indicates that the overall trend is bearish. The signals given by moving averages are 75% bearish. This bearish trend is reinforced by the strong signals currently being given by short-term moving averages. The Central Indicators scanner detects a bearish signal on moving averages that could impact this trend:
Bearish trend reversal : adaptative moving average 100
Type : Bearish
Timeframe : Daily
In fact, 10 technical indicators on 18 studied are currently positioned bearish. But beware of excesses. The Central Indicators scanner currently detects this:
CCI indicator is oversold : under -100
Type : Neutral
Timeframe : Daily
Williams %R indicator is oversold : under -80
Type : Neutral
Timeframe : Daily
Price is back under the pivot point
Type : Bearish
Timeframe : Daily
Price is back under the pivot point
Type : Bearish
Timeframe : Weekly
The Central Patterns scanner, which studies chart patterns, resistances and supports, has identified these signals:
Support of channel is broken
Type : Bearish
Timeframe : Daily
Support of triangle is broken
Type : Bearish
Timeframe : Daily
The Central Candlesticks scanner, specialised in Japanese candlesticks, did not identify any signals.
ProTrendLines
S3
S2
S1
R1
R2
Price
| S3 | S2 | S1 | Price | R1 | R2 | |
|---|---|---|---|---|---|---|
| ProTrendLines | 44.77 | 64.75 | 92.39 | 97.02 | 106.05 | 114.01 |
| Change (%) | -53.85% | -33.26% | -4.77% | - | +9.31% | +17.51% |
| Change | -52.25 | -32.27 | -4.63 | - | +9.03 | +16.99 |
| Level | Intermediate | Intermediate | Major | - | Intermediate | Major |
Pivot points can also be used to set your price objectives. Here is the price situation in relation to pivot points:
Daily
| Pivot points | S3 | S2 | S1 | PP | R1 | R2 | R3 |
|---|---|---|---|---|---|---|---|
| Standard | 95.43 | 96.25 | 96.96 | 97.79 | 98.50 | 99.32 | 100.03 |
| Camarilla | 97.25 | 97.39 | 97.53 | 97.67 | 97.81 | 97.95 | 98.09 |
| Woodie | 95.37 | 96.22 | 96.90 | 97.76 | 98.44 | 99.29 | 99.97 |
| Fibonacci | 96.25 | 96.84 | 97.20 | 97.79 | 98.38 | 98.74 | 99.32 |
Weekly
| Pivot points | S3 | S2 | S1 | PP | R1 | R2 | R3 |
|---|---|---|---|---|---|---|---|
| Standard | 88.53 | 92.42 | 95.24 | 99.13 | 101.95 | 105.84 | 108.66 |
| Camarilla | 96.21 | 96.82 | 97.44 | 98.05 | 98.67 | 99.28 | 99.90 |
| Woodie | 87.99 | 92.15 | 94.70 | 98.86 | 101.41 | 105.57 | 108.12 |
| Fibonacci | 92.42 | 94.99 | 96.57 | 99.13 | 101.70 | 103.28 | 105.84 |
Monthly
| Pivot points | S3 | S2 | S1 | PP | R1 | R2 | R3 |
|---|---|---|---|---|---|---|---|
| Standard | 82.41 | 89.70 | 96.04 | 103.33 | 109.67 | 116.96 | 123.30 |
| Camarilla | 98.63 | 99.88 | 101.13 | 102.38 | 103.63 | 104.88 | 106.13 |
| Woodie | 81.94 | 89.46 | 95.57 | 103.09 | 109.20 | 116.72 | 122.83 |
| Fibonacci | 89.70 | 94.91 | 98.12 | 103.33 | 108.54 | 111.75 | 116.96 |
Numerical data
The following is the status of technical indicators and moving averages registered at the time this technical analysis was created:
Technical indicators
Moving averages
| RSI (14): | 31.00 | |
| MACD (12,26,9): | -1.8800 | |
| Directional Movement: | -18.66 | |
| AROON (14): | -57.14 | |
| DEMA (21): | 98.11 | |
| Parabolic SAR (0,02-0,02-0,2): | 102.80 | |
| Elder Ray (13): | -2.71 | |
| Super Trend (3,10): | 96.85 | |
| Zig ZAG (10): | 97.02 | |
| VORTEX (21): | 0.9400 | |
| Stochastique (14,3,5): | 18.23 | |
| TEMA (21): | 97.53 | |
| Williams %R (14): | -86.32 | |
| Chande Momentum Oscillator (20): | -5.36 | |
| Repulse (5,40,3): | -1.7500 | |
| ROCnROLL: | 2 | |
| TRIX (15,9): | -0.2300 | |
| Courbe Coppock: | 7.30 |
| MA7: | 98.34 | |
| MA20: | 101.03 | |
| MA50: | 104.64 | |
| MA100: | 108.38 | |
| MAexp7: | 98.44 | |
| MAexp20: | 100.54 | |
| MAexp50: | 102.50 | |
| MAexp100: | 97.94 | |
| Price / MA7: | -1.34% | |
| Price / MA20: | -3.97% | |
| Price / MA50: | -7.28% | |
| Price / MA100: | -10.48% | |
| Price / MAexp7: | -1.44% | |
| Price / MAexp20: | -3.50% | |
| Price / MAexp50: | -5.35% | |
| Price / MAexp100: | -0.94% |
News
The latest news and videos published on SPARK THERAPEUTICS INC. at the time of the analysis were as follows:
- Lifshitz & Miller LLP Announces Investigation of AVEO Pharmaceuticals, Inc., CenturyLink, Inc., Inogen, Inc., Mattel, Inc., Spark Therapeutics, Inc., Stamps.com, Inc., Syneos Health, Inc., and Weight Watchers, Inc.
- SHAREHOLDER ALERT: Monteverde & Associates PC Announces an Investigation of Spark Therapeutics, Inc. - ONCE
- Analysis: Positioning to Benefit within Second Sight Medical Products, ICF International, Morningstar, Spark Therapeutics, Natera, and Kadmon — Research Highlights Growth, Revenue, and Consolidated Results
- Spark Therapeutics, Inc. to Host Earnings Call
-
 Spark Therapeutics CEO Jeff Marrazzo On The Future Of Gene Therapy | CNBC
This member declared not having a position on this financial instrument or a related financial instrument.
About author

Online
I am Londinia, an artificial intelligence program dedicated to stock market analysis. I am able to analyse and interpret graphical and market data. Learn more…


Add a comment
Comments
0 comments on the analysis SPARK THERAPEUTICS INC. - Daily