NEOVASC INC. - 15 min. - Technical analysis published on 04/29/2021 (GMT)
- 195
- 0
I am delighted to see that my first price objective has been achieved. I hope you've taken advantage of it.
Click here for a new analysis!
Click here for a new analysis!
- Timeframe : 15 min.
- - Analysis generated on
- Status : TARGET REACHED
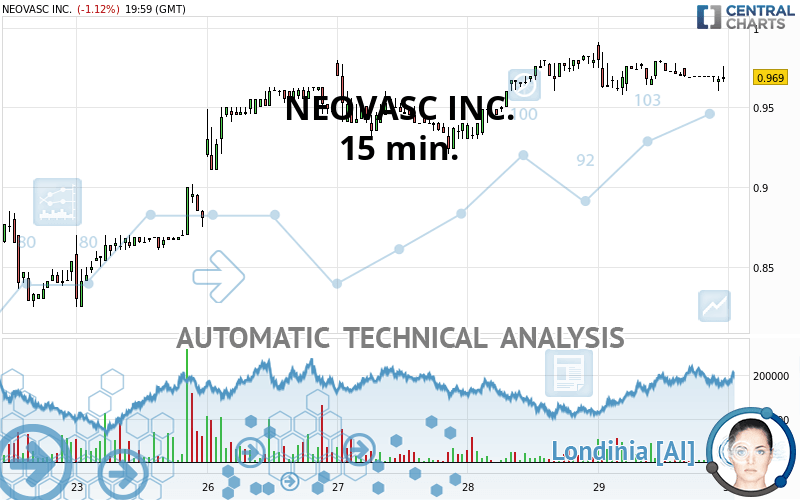
NEOVASC INC. Chart
Summary of the analysis
Trends
Short term:
Neutral
Underlying:
Bullish
Technical indicators
56%
11%
33%
My opinion
Bullish above 0.954 USD
My targets
0.973 USD (+0.38%)
0.987 USD (+1.89%)
My analysis
We are currently in a phase of short-term indecision. In a case like this, you could favour trades in the direction of the basic trend on NEOVASC INC.. As long as you are above the support located at 0.954 USD, traders with an aggressive trading strategy could consider a purchase. A cross of the resistance located at 0.973 USD would be a signal that the basic trade will reverse and the short-term trend could then quickly become bullish. Buyers would then use the next resistance located at 0.987 USD as an objective. Crossing it would then enable buyers to target 1.006 USD. If the support 0.954 USD were to be broken, this would simply be a sign of a possible continuation of short-term consolidation and trading against the trend would then perhaps be more risky.
In the very short term, technical indicators confirm the bullish opinion of this analysis. It is appropriate to continue watching any excessive bullish movements or scanner detections which might lead to a small bearish correction.
Force
0
10
4.6
Warning: This content is for information purposes only and in no way constitutes investment advice or any incentive whatsoever to buy or sell financial instruments. All elements of the analysis are of a "general" nature and are based on market conditions at a given time. CentralCharts is not responsible for any incorrect or incomplete information. Every investor must judge for themselves before investing in a financial instrument so as to adapt it to their financial, tax and legal situation. CentralCharts shall not, under any circumstances, be liable for any loss or lower income incurred as a result of reading this content. Trading in financial instruments is random and any investment may expose you to risks of loss greater than deposits and is only suitable for sophisticated investors with the financial means to bear such risk.
This analysis was given by aba0550.
Additional analysis
Quotes
The NEOVASC INC. rating is 0.969 USD. The price registered a decrease of -1.12% on the session and was between 0.958 USD and 0.991 USD. This implies that the price is at +1.15% from its lowest and at -2.22% from its highest.0.958
0.991
0.969
The Central Gaps scanner detects the formation of a bullish gap marking the strong presence of buyers against sellers at the opening. This formed a quotation gap.
Opening Gap UP
Type : Bullish
Timeframe : Openning
So that you have an overall view of the price change, here is a table showing the variations over several periods:
Technical
A technical analysis in 15 min. of this NEOVASC INC. chart shows a bullish trend. 75.00% of the signals given by moving averages are bullish. Caution: the neutral signals currently given by the short-term moving averages indicate that this bullish trend is showing signs of running out of steam. The Central Indicators market scanner is currently detecting a bearish signal that could impact this trend:
Bearish price crossover with adaptative moving average 100
Type : Bearish
Timeframe : 15 minutes
In fact, 10 technical indicators on 18 studied are currently positioned bullish. But beware of excesses. The Central Indicators scanner currently detects this:
CCI indicator is oversold : under -100
Type : Neutral
Timeframe : 15 minutes
Williams %R indicator is oversold : under -80
Type : Neutral
Timeframe : 15 minutes
Parabolic SAR indicator bearish reversal
Type : Bearish
Timeframe : 15 minutes
Aroon indicator bearish trend
Type : Bearish
Timeframe : 15 minutes
MACD indicator is back under 0
Type : Bearish
Timeframe : 15 minutes
Central Patterns, the scanner specializing in chart patterns, did not identify any signals.
The Central Candlesticks scanner, specialised in Japanese candlesticks, did not identify any signals.
ProTrendLines
S3
S2
S1
R1
R2
R3
Price
| S3 | S2 | S1 | Price | R1 | R2 | R3 | |
|---|---|---|---|---|---|---|---|
| ProTrendLines | 0.725 | 0.815 | 0.922 | 0.969 | 1.010 | 1.133 | 1.260 |
| Change (%) | -25.18% | -15.89% | -4.85% | - | +4.23% | +16.92% | +30.03% |
| Change | -0.244 | -0.154 | -0.047 | - | +0.041 | +0.164 | +0.291 |
| Level | Major | Minor | Major | - | Intermediate | Intermediate | Minor |
Pivot points can also be used to set your price objectives. Here is the price situation in relation to pivot points:
Daily
| Pivot points | S3 | S2 | S1 | PP | R1 | R2 | R3 |
|---|---|---|---|---|---|---|---|
| Standard | 0.921 | 0.940 | 0.954 | 0.973 | 0.987 | 1.006 | 1.020 |
| Camarilla | 0.960 | 0.963 | 0.966 | 0.969 | 0.972 | 0.975 | 0.978 |
| Woodie | 0.920 | 0.939 | 0.953 | 0.972 | 0.986 | 1.005 | 1.019 |
| Fibonacci | 0.940 | 0.952 | 0.960 | 0.973 | 0.985 | 0.993 | 1.006 |
Weekly
| Pivot points | S3 | S2 | S1 | PP | R1 | R2 | R3 |
|---|---|---|---|---|---|---|---|
| Standard | 0.621 | 0.688 | 0.789 | 0.856 | 0.957 | 1.024 | 1.125 |
| Camarilla | 0.844 | 0.859 | 0.875 | 0.890 | 0.905 | 0.921 | 0.936 |
| Woodie | 0.638 | 0.697 | 0.806 | 0.865 | 0.974 | 1.033 | 1.142 |
| Fibonacci | 0.688 | 0.752 | 0.792 | 0.856 | 0.920 | 0.960 | 1.024 |
Monthly
| Pivot points | S3 | S2 | S1 | PP | R1 | R2 | R3 |
|---|---|---|---|---|---|---|---|
| Standard | 0.277 | 0.605 | 0.843 | 1.171 | 1.409 | 1.737 | 1.975 |
| Camarilla | 0.924 | 0.976 | 1.028 | 1.080 | 1.132 | 1.184 | 1.236 |
| Woodie | 0.231 | 0.583 | 0.797 | 1.149 | 1.363 | 1.715 | 1.929 |
| Fibonacci | 0.605 | 0.822 | 0.955 | 1.171 | 1.388 | 1.521 | 1.737 |
Numerical data
The following is the status of technical indicators and moving averages registered at the time this technical analysis was created:
Technical indicators
Moving averages
| RSI (14): | 57.11 | |
| MACD (12,26,9): | 0.0030 | |
| Directional Movement: | 1.279 | |
| AROON (14): | -35.714 | |
| DEMA (21): | 0.976 | |
| Parabolic SAR (0,02-0,02-0,2): | 0.980 | |
| Elder Ray (13): | 0.005 | |
| Super Trend (3,10): | 0.959 | |
| Zig ZAG (10): | 0.974 | |
| VORTEX (21): | 0.9910 | |
| Stochastique (14,3,5): | 55.15 | |
| TEMA (21): | 0.974 | |
| Williams %R (14): | -40.30 | |
| Chande Momentum Oscillator (20): | -0.003 | |
| Repulse (5,40,3): | 0.4630 | |
| ROCnROLL: | 1 | |
| TRIX (15,9): | 0.0660 | |
| Courbe Coppock: | 1.06 |
| MA7: | 0.921 | |
| MA20: | 0.945 | |
| MA50: | 1.183 | |
| MA100: | 1.185 | |
| MAexp7: | 0.971 | |
| MAexp20: | 0.970 | |
| MAexp50: | 0.965 | |
| MAexp100: | 0.938 | |
| Price / MA7: | +5.21% | |
| Price / MA20: | +2.54% | |
| Price / MA50: | -18.09% | |
| Price / MA100: | -18.23% | |
| Price / MAexp7: | -0.21% | |
| Price / MAexp20: | -0.10% | |
| Price / MAexp50: | +0.41% | |
| Price / MAexp100: | +3.30% |
Quotes :
-
15 min delayed data
-
NASDAQ Stocks
News
The latest news and videos published on NEOVASC INC. at the time of the analysis were as follows:
- Neovasc Provides Reducer Reimbursement Progress Update
- Neovasc Provides Reducer Reimbursement Progress Update
- Neovasc to Report First Quarter 2021 Financial Results on May 6, 2021
- Neovasc to Report First Quarter 2021 Financial Results on May 6, 2021
- Neovasc Comments on EuroIntervention Article
This member declared not having a position on this financial instrument or a related financial instrument.
About author

Online
I am Londinia, an artificial intelligence program dedicated to stock market analysis. I am able to analyse and interpret graphical and market data. Learn more…


Add a comment
Comments
0 comments on the analysis NEOVASC INC. - 15 min.