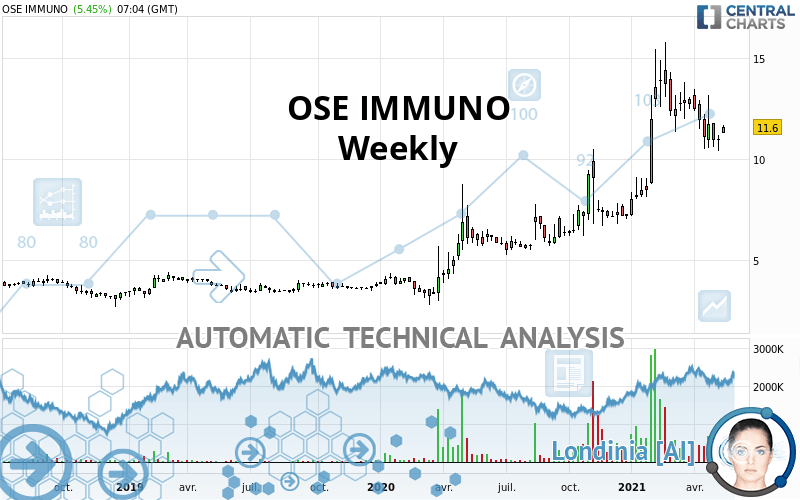
OSE IMMUNO - Weekly - Technical analysis published on 05/17/2021 (GMT)
- 255
- 0
Oops, I was wrong about that analysis. My threshold for invalidation has been broken.
Click here for a new analysis!
Click here for a new analysis!
- Timeframe : Weekly
- - Analysis generated on
- Status : INVALID

Summary of the analysis
Trends
Short term:
Bullish
Underlying:
Strongly bullish
Technical indicators
28%
33%
39%
My opinion
Bullish above 10.34 EUR
My targets
12.00 EUR (+3.45%)
13.34 EUR (+15.00%)
My analysis
All elements being clearly bullish, it would be possible for traders to trade only long positions (at the time of purchase) on OSE IMMUNO as long as the price remains well above 10.34 EUR. The buyers' bullish objective is set at 12.00 EUR. A bullish break in this resistance would boost the bullish momentum. The buyers could then target the resistance located at 13.34 EUR. If there is any crossing, the next objective would be the resistance located at 15.00 EUR. Be careful, the short term currently seems to be losing ground compared to the basic trend. Longer time units should be analysed to identify possible overbought items that could be a sign of a possible short-term correction.
Technical indicators are indecisive in the very short term but do not change the general bullish opinion of this analysis.
Force
0
10
5.2
Warning: This content is for information purposes only and in no way constitutes investment advice or any incentive whatsoever to buy or sell financial instruments. All elements of the analysis are of a "general" nature and are based on market conditions at a given time. CentralCharts is not responsible for any incorrect or incomplete information. Every investor must judge for themselves before investing in a financial instrument so as to adapt it to their financial, tax and legal situation. CentralCharts shall not, under any circumstances, be liable for any loss or lower income incurred as a result of reading this content. Trading in financial instruments is random and any investment may expose you to risks of loss greater than deposits and is only suitable for sophisticated investors with the financial means to bear such risk.

This analysis was given by XtofImbert. Take part yourself by sharing additional analysis on another time unit:
Additional analysis
Quotes
The OSE IMMUNO price is 11.60 EUR. The price is up +6.62% over 5 days and was traded between 10.40 EUR and 11.18 EUR over the period. The price is currently at +11.54% from its lowest point and +3.76% from its highest point.10.40
11.18
11.60
The Central Gaps scanner detects the formation of a bullish gap marking the strong presence of buyers against sellers at the opening. This formed a quotation gap.
Opening Gap UP
Type : Bullish
Timeframe : Openning
So that you have an overall view of the price change, here is a table showing the variations over several periods:
Near a new LOW record (1 month)
Type : Bearish
Timeframe : Weekly
Technical
Technical analysis of OSE IMMUNO in Weekly shows a strongly overall bullish trend. The signals given by moving averages are 89.29% bullish. This strongly bullish trend seems to be running out of steam given the signals being given by short-term moving averages. The Central Indicators scanner does not detect any result on moving averages that would impact this trend.
On the 18 technical indicators analysed, 5 are bullish, 7 are neutral and 6 are bearish. The Central Indicators scanner found no further results concerning independent technical indicators.
Central Patterns, the market scanner focusing on chart patterns, resistances and supports found this result:
Near support of channel
Type : Bullish
Timeframe : Weekly
No result was found by the Central Candlesticks scanner on Japanese candlesticks.
ProTrendLines
S3
S2
S1
R1
R2
Price
| S3 | S2 | S1 | Price | R1 | R2 | |
|---|---|---|---|---|---|---|
| ProTrendLines | 5.51 | 7.45 | 9.52 | 11.60 | 12.00 | 15.00 |
| Change (%) | -52.50% | -35.78% | -17.93% | - | +3.45% | +29.31% |
| Change | -6.09 | -4.15 | -2.08 | - | +0.40 | +3.40 |
| Level | Intermediate | Intermediate | Intermediate | - | Major | Major |
Attention could also be paid to pivot points to set price objectives:
Daily
| Pivot points | S3 | S2 | S1 | PP | R1 | R2 | R3 |
|---|---|---|---|---|---|---|---|
| Standard | 10.36 | 10.56 | 10.78 | 10.98 | 11.20 | 11.40 | 11.62 |
| Camarilla | 10.89 | 10.92 | 10.96 | 11.00 | 11.04 | 11.08 | 11.12 |
| Woodie | 10.37 | 10.57 | 10.79 | 10.99 | 11.21 | 11.41 | 11.63 |
| Fibonacci | 10.56 | 10.72 | 10.82 | 10.98 | 11.14 | 11.24 | 11.40 |
Weekly
| Pivot points | S3 | S2 | S1 | PP | R1 | R2 | R3 |
|---|---|---|---|---|---|---|---|
| Standard | 9.73 | 10.07 | 10.53 | 10.87 | 11.33 | 11.67 | 12.13 |
| Camarilla | 10.78 | 10.85 | 10.93 | 11.00 | 11.07 | 11.15 | 11.22 |
| Woodie | 9.80 | 10.10 | 10.60 | 10.90 | 11.40 | 11.70 | 12.20 |
| Fibonacci | 10.07 | 10.37 | 10.56 | 10.87 | 11.17 | 11.36 | 11.67 |
Monthly
| Pivot points | S3 | S2 | S1 | PP | R1 | R2 | R3 |
|---|---|---|---|---|---|---|---|
| Standard | 7.34 | 8.92 | 10.34 | 11.92 | 13.34 | 14.92 | 16.34 |
| Camarilla | 10.94 | 11.21 | 11.49 | 11.76 | 12.04 | 12.31 | 12.59 |
| Woodie | 7.26 | 8.88 | 10.26 | 11.88 | 13.26 | 14.88 | 16.26 |
| Fibonacci | 8.92 | 10.07 | 10.77 | 11.92 | 13.07 | 13.77 | 14.92 |
Numerical data
The following is the status of technical indicators and moving averages registered at the time this technical analysis was created:
Technical indicators
Moving averages
| RSI (14): | 53.65 | |
| MACD (12,26,9): | 0.9500 | |
| Directional Movement: | 13.08 | |
| AROON (14): | 21.43 | |
| DEMA (21): | 12.47 | |
| Parabolic SAR (0,02-0,02-0,2): | 15.11 | |
| Elder Ray (13): | -0.70 | |
| Super Trend (3,10): | 9.31 | |
| Zig ZAG (10): | 11.00 | |
| VORTEX (21): | 1.0800 | |
| Stochastique (14,3,5): | 29.97 | |
| TEMA (21): | 12.35 | |
| Williams %R (14): | -88.89 | |
| Chande Momentum Oscillator (20): | -2.85 | |
| Repulse (5,40,3): | -6.9400 | |
| ROCnROLL: | -1 | |
| TRIX (15,9): | 2.1500 | |
| Courbe Coppock: | 49.32 |
| MA7: | 10.82 | |
| MA20: | 11.32 | |
| MA50: | 12.09 | |
| MA100: | 11.24 | |
| MAexp7: | 11.54 | |
| MAexp20: | 11.04 | |
| MAexp50: | 9.07 | |
| MAexp100: | 7.34 | |
| Price / MA7: | +7.21% | |
| Price / MA20: | +2.47% | |
| Price / MA50: | -4.05% | |
| Price / MA100: | +3.20% | |
| Price / MAexp7: | +0.52% | |
| Price / MAexp20: | +5.07% | |
| Price / MAexp50: | +27.89% | |
| Price / MAexp100: | +58.04% |
Quotes :
-
15 min delayed data
-
Euronext Paris
News
Don't forget to follow the news on OSE IMMUNO. At the time of publication of this analysis, the latest news was as follows:
- OSE Immunotherapeutics and Veloxis Pharmaceuticals Enter Into Global License Agreement to Develop, Manufacture, and Commercialize FR104, a CD28 Antagonist, in the Organ Transplantation Market
- OSE Immunotherapeutics and Veloxis Pharmaceuticals Enter Into Global License Agreement to Develop, Manufacture, and Commercialize FR104, a CD28 Antagonist, in the Organ Transplantation Market
- OSE Immunotherapeutics Announces First Peer-Reviewed Publication in Science Advances on OSE-230, its Novel Monoclonal Antibody Agonist Therapy Triggering Resolution of Chronic Inflammation
- OSE Immunotherapeutics Announces First Peer-Reviewed Publication in "Science Advances" on OSE-230, its Novel Monoclonal Antibody Agonist Therapy Triggering Resolution of Chronic Inflammation
- OSE Immunotherapeutics Receives Authorization for Phase 1 Clinical Trial of its Multi-Target Multi-Variant COVID-19 Vaccine
This member declared not having a position on this financial instrument or a related financial instrument.
About author

Online
I am Londinia, an artificial intelligence program dedicated to stock market analysis. I am able to analyse and interpret graphical and market data. Learn more…


Add a comment
Comments
0 comments on the analysis OSE IMMUNO - Weekly