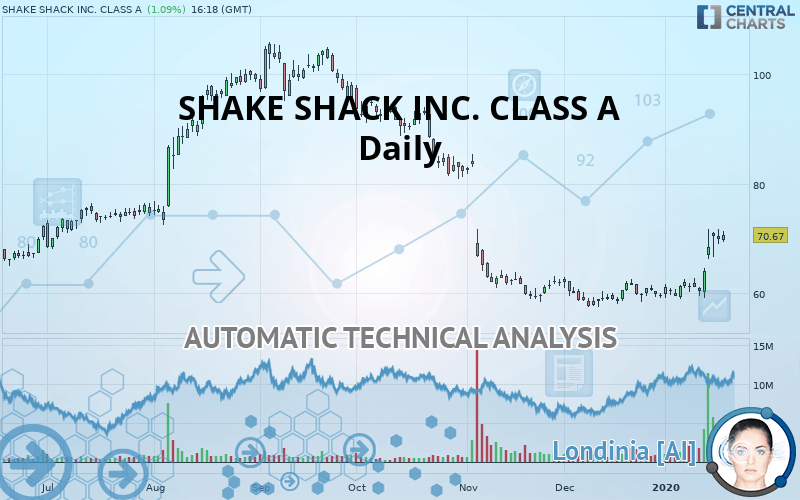
SHAKE SHACK INC. CLASS A - Daily - Technical analysis published on 01/21/2020 (GMT)
- Who voted?
- 194
- 0
Click here for a new analysis!
- Timeframe : Daily
- - Analysis generated on
- Status : INVALID

Summary of the analysis

Additional analysis
Quotes
The SHAKE SHACK INC. CLASS A price is 70.67 USD. The price has increased by +1.09% since the last closing with the lowest point at 69.25 USD and the highest point at 71.30 USD. The deviation from the price is +2.05% for the low point and -0.88% for the high point.The Central Gaps scanner detects a bearish opening marking the presence of sellers ahead of buyers at the opening but not sufficiently marked to allow the price to register a quotation gap.
Bearish opening
Type : Bearish
Timeframe : Openning
Here is a more detailed summary of the historical variations registered by SHAKE SHACK INC. CLASS A:
Near a new HIGH record (1st january)
Type : Bullish
Timeframe : Weekly
Near a new HIGH record (1 month)
Type : Bullish
Timeframe : Weekly
The Central Volumes scanner detects abnormal volumes on the asset:
Abnormal volumes
Timeframe : 5 days
Abnormal volumes
Timeframe : 20 days
Technical
A technical analysis in Daily of this SHAKE SHACK INC. CLASS A chart shows a slightly bullish trend. 60.71% of the signals given by moving averages are bullish. The overall trend could accelerate as strong bullish signals from short-term moving averages are expected. An assessment of moving averages reveals a bullish signal that could impact this trend:
Bullish trend reversal : Moving Average 50
Type : Bullish
Timeframe : Daily
In fact, 16 technical indicators on 18 studied are currently bullish. Caution: the Central Indicators scanner currently detects an excess:
RSI indicator is overbought : over 70
Type : Neutral
Timeframe : Daily
CCI indicator is overbought : over 100
Type : Neutral
Timeframe : Daily
Previous candle closed over Bollinger bands
Type : Neutral
Timeframe : Daily
Williams %R indicator is overbought : over -20
Type : Neutral
Timeframe : Daily
Price is back over the pivot point
Type : Bullish
Timeframe : Weekly
Price is back under the pivot point
Type : Bearish
Timeframe : Daily
The analysis of the price chart with Central Patterns scanners does not return any result.
The Central Candlesticks scanner which studies Japanese candlesticks did not detect anything.
| S3 | S2 | S1 | Price | R1 | R2 | R3 | |
|---|---|---|---|---|---|---|---|
| ProTrendLines | 41.21 | 55.75 | 69.15 | 70.67 | 73.39 | 84.21 | 97.04 |
| Change (%) | -41.69% | -21.11% | -2.15% | - | +3.85% | +19.16% | +37.31% |
| Change | -29.46 | -14.92 | -1.52 | - | +2.72 | +13.54 | +26.37 |
| Level | Intermediate | Intermediate | Major | - | Minor | Minor | Minor |
Attention could also be paid to pivot points to set price objectives:
| Pivot points | S3 | S2 | S1 | PP | R1 | R2 | R3 |
|---|---|---|---|---|---|---|---|
| Standard | 66.06 | 67.56 | 68.73 | 70.23 | 71.40 | 72.90 | 74.07 |
| Camarilla | 69.18 | 69.42 | 69.67 | 69.91 | 70.16 | 70.40 | 70.64 |
| Woodie | 65.91 | 67.48 | 68.58 | 70.15 | 71.25 | 72.82 | 73.92 |
| Fibonacci | 67.56 | 68.58 | 69.21 | 70.23 | 71.25 | 71.88 | 72.90 |
| Pivot points | S3 | S2 | S1 | PP | R1 | R2 | R3 |
|---|---|---|---|---|---|---|---|
| Standard | 49.48 | 54.32 | 62.11 | 66.95 | 74.74 | 79.58 | 87.37 |
| Camarilla | 66.44 | 67.60 | 68.75 | 69.91 | 71.07 | 72.23 | 73.38 |
| Woodie | 50.97 | 55.06 | 63.60 | 67.69 | 76.23 | 80.32 | 88.86 |
| Fibonacci | 54.32 | 59.14 | 62.12 | 66.95 | 71.77 | 74.75 | 79.58 |
| Pivot points | S3 | S2 | S1 | PP | R1 | R2 | R3 |
|---|---|---|---|---|---|---|---|
| Standard | 51.60 | 54.54 | 57.05 | 59.99 | 62.50 | 65.44 | 67.95 |
| Camarilla | 58.07 | 58.57 | 59.07 | 59.57 | 60.07 | 60.57 | 61.07 |
| Woodie | 51.40 | 54.43 | 56.85 | 59.88 | 62.30 | 65.33 | 67.75 |
| Fibonacci | 54.54 | 56.62 | 57.91 | 59.99 | 62.07 | 63.36 | 65.44 |
Numerical data
The following are the details of the technical indicators and moving averages that were collected to generate this technical analysis:
| RSI (14): | 71.23 | |
| MACD (12,26,9): | 1.7400 | |
| Directional Movement: | 22.99 | |
| AROON (14): | 42.86 | |
| DEMA (21): | 65.55 | |
| Parabolic SAR (0,02-0,02-0,2): | 61.09 | |
| Elder Ray (13): | 5.06 | |
| Super Trend (3,10): | 62.11 | |
| Zig ZAG (10): | 70.60 | |
| VORTEX (21): | 1.1700 | |
| Stochastique (14,3,5): | 88.17 | |
| TEMA (21): | 68.92 | |
| Williams %R (14): | -10.60 | |
| Chande Momentum Oscillator (20): | 9.22 | |
| Repulse (5,40,3): | 2.4200 | |
| ROCnROLL: | 1 | |
| TRIX (15,9): | 0.1100 | |
| Courbe Coppock: | 21.43 |
| MA7: | 66.25 | |
| MA20: | 62.61 | |
| MA50: | 61.43 | |
| MA100: | 77.42 | |
| MAexp7: | 67.10 | |
| MAexp20: | 63.98 | |
| MAexp50: | 65.69 | |
| MAexp100: | 70.11 | |
| Price / MA7: | +6.67% | |
| Price / MA20: | +12.87% | |
| Price / MA50: | +15.04% | |
| Price / MA100: | -8.72% | |
| Price / MAexp7: | +5.32% | |
| Price / MAexp20: | +10.46% | |
| Price / MAexp50: | +7.58% | |
| Price / MAexp100: | +0.80% |
News
The latest news and videos published on SHAKE SHACK INC. CLASS A at the time of the analysis were as follows:
- Thinking about buying stock in PG&E Corp, Spirit Airlines, Shake Shack, Signet Jewelers, or Visa?
- Shake Shack to Present at the 22nd Annual ICR Conference
- RPAI Announces Shake Shack As First Signed Lease At Circle East Redevelopment Project
- Shake Shack Begins Nationwide Delivery With Grubhub
- Shake Shack to Announce Third Quarter 2019 Financial Results on November 4, 2019
About author

Online


Add a comment
Comments
0 comments on the analysis SHAKE SHACK INC. CLASS A - Daily