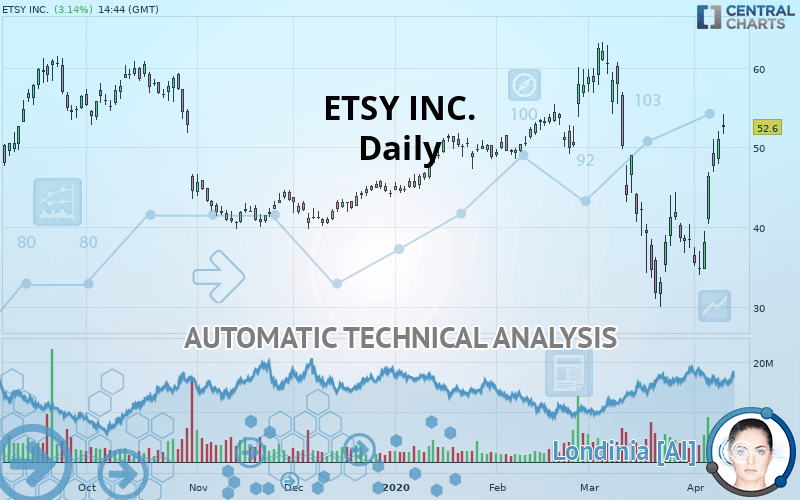
ETSY INC. - Daily - Technical analysis published on 04/09/2020 (GMT)
- Who voted?
- 350
- 0
Click here for a new analysis!
- Timeframe : Daily
- - Analysis generated on
- Status : TARGET REACHED

Summary of the analysis

Additional analysis
Quotes
The ETSY INC. rating is 52.60 USD. On the day, this instrument gained +3.14% with the lowest point at 51.64 USD and the highest point at 54.15 USD. The deviation from the price is +1.86% for the low point and -2.86% for the high point.A bullish gap was detected at the opening by the Central Gaps scanner. There are a lot of buyers and they have the upper hand in the very short term.
Opening Gap UP
Type : Bullish
Timeframe : Openning
A study of price movements over other periods shows the following variations:
Technical
Technical analysis of this Daily chart of ETSY INC. indicates that the overall trend is bullish. 75% of the signals given by moving averages are bullish. This bullish trend is supported by the strong bullish signals given by short-term moving averages. The Central Indicators market scanner is currently detecting several bullish signals that could impact this trend:
Bullish trend reversal : Moving Average 20
Type : Bullish
Timeframe : Daily
Bullish trend reversal : Moving Average 50
Type : Bullish
Timeframe : Daily
Bullish trend reversal : adaptative moving average 100
Type : Bullish
Timeframe : Daily
Bullish price crossover with Moving Average 50
Type : Bullish
Timeframe : Daily
Bullish price crossover with adaptative moving average 50
Type : Bullish
Timeframe : Daily
An assessment of technical indicators shows a strong bullish signal.
But beware of excesses. The Central Indicators scanner currently detects this:
CCI indicator is overbought : over 100
Type : Neutral
Timeframe : Daily
Williams %R indicator is overbought : over -20
Type : Neutral
Timeframe : Daily
Pivot points : price is over resistance 1
Type : Neutral
Timeframe : Daily
Pivot points : price is over resistance 3
Type : Neutral
Timeframe : Weekly
The Central Patterns scanner, which studies chart patterns, resistances and supports, has identified these signals:
Near horizontal resistance
Type : Bearish
Timeframe : Daily
Resistance of channel is broken
Type : Bullish
Timeframe : Daily
No result was found by the Central Candlesticks scanner on Japanese candlesticks.
| S3 | S2 | S1 | Price | R1 | R2 | R3 | |
|---|---|---|---|---|---|---|---|
| ProTrendLines | 40.45 | 44.40 | 47.98 | 52.60 | 54.08 | 62.46 | 66.86 |
| Change (%) | -23.10% | -15.59% | -8.78% | - | +2.81% | +18.75% | +27.11% |
| Change | -12.15 | -8.20 | -4.62 | - | +1.48 | +9.86 | +14.26 |
| Level | Major | Intermediate | Major | - | Major | Major | Minor |
Attention could also be paid to pivot points to set price objectives:
| Pivot points | S3 | S2 | S1 | PP | R1 | R2 | R3 |
|---|---|---|---|---|---|---|---|
| Standard | 44.34 | 46.11 | 48.55 | 50.32 | 52.76 | 54.53 | 56.97 |
| Camarilla | 49.84 | 50.23 | 50.61 | 51.00 | 51.39 | 51.77 | 52.16 |
| Woodie | 44.69 | 46.28 | 48.90 | 50.49 | 53.11 | 54.70 | 57.32 |
| Fibonacci | 46.11 | 47.72 | 48.71 | 50.32 | 51.93 | 52.92 | 54.53 |
| Pivot points | S3 | S2 | S1 | PP | R1 | R2 | R3 |
|---|---|---|---|---|---|---|---|
| Standard | 28.27 | 31.12 | 34.63 | 37.48 | 40.99 | 43.84 | 47.35 |
| Camarilla | 36.40 | 36.98 | 37.57 | 38.15 | 38.73 | 39.32 | 39.90 |
| Woodie | 28.61 | 31.29 | 34.97 | 37.65 | 41.33 | 44.01 | 47.69 |
| Fibonacci | 31.12 | 33.55 | 35.05 | 37.48 | 39.91 | 41.41 | 43.84 |
| Pivot points | S3 | S2 | S1 | PP | R1 | R2 | R3 |
|---|---|---|---|---|---|---|---|
| Standard | -8.78 | 10.59 | 24.51 | 43.88 | 57.80 | 77.17 | 91.09 |
| Camarilla | 29.29 | 32.34 | 35.39 | 38.44 | 41.49 | 44.54 | 47.60 |
| Woodie | -11.50 | 9.23 | 21.80 | 42.52 | 55.09 | 75.81 | 88.38 |
| Fibonacci | 10.59 | 23.30 | 31.16 | 43.88 | 56.59 | 64.45 | 77.17 |
Numerical data
The following is the status of technical indicators and moving averages registered at the time this technical analysis was created:
| RSI (14): | 61.36 | |
| MACD (12,26,9): | -0.3400 | |
| Directional Movement: | 14.33 | |
| AROON (14): | 92.86 | |
| DEMA (21): | 42.65 | |
| Parabolic SAR (0,02-0,02-0,2): | 35.05 | |
| Elder Ray (13): | 8.83 | |
| Super Trend (3,10): | 39.29 | |
| Zig ZAG (10): | 52.55 | |
| VORTEX (21): | 0.9000 | |
| Stochastique (14,3,5): | 90.82 | |
| TEMA (21): | 44.08 | |
| Williams %R (14): | -6.65 | |
| Chande Momentum Oscillator (20): | 14.34 | |
| Repulse (5,40,3): | 5.5800 | |
| ROCnROLL: | 1 | |
| TRIX (15,9): | -0.8600 | |
| Courbe Coppock: | 36.46 |
| MA7: | 43.75 | |
| MA20: | 40.73 | |
| MA50: | 48.34 | |
| MA100: | 46.60 | |
| MAexp7: | 46.21 | |
| MAexp20: | 44.04 | |
| MAexp50: | 46.14 | |
| MAexp100: | 47.93 | |
| Price / MA7: | +20.23% | |
| Price / MA20: | +29.14% | |
| Price / MA50: | +8.81% | |
| Price / MA100: | +12.88% | |
| Price / MAexp7: | +13.83% | |
| Price / MAexp20: | +19.44% | |
| Price / MAexp50: | +14.00% | |
| Price / MAexp100: | +9.74% |
News
The latest news and videos published on ETSY INC. at the time of the analysis were as follows:
- Etsy Provides Update on Business Conditions Related to COVID-19
- Etsy Updates Advertising Offerings
- Etsy to Announce Fourth Quarter and Year End 2019 Financial Results on February 26, 2020
- Etsy to Participate at Upcoming Investor Conferences
- Etsy to Participate at Upcoming Investor Conferences
About author

Online


Add a comment
Comments
0 comments on the analysis ETSY INC. - Daily