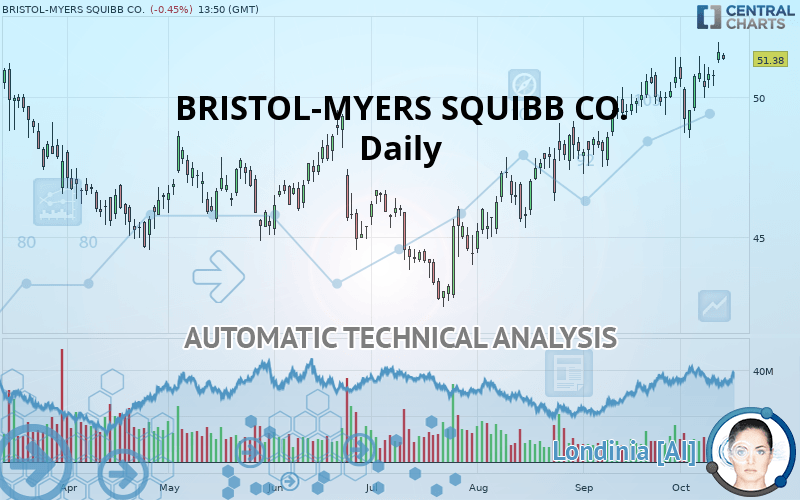
BRISTOL-MYERS SQUIBB CO. - Daily - Technical analysis published on 10/14/2019 (GMT)
- Who voted?
- 312
- 0
I am delighted to see that my first price objective has been achieved. I hope you've taken advantage of it.
Click here for a new analysis!
Click here for a new analysis!
- Timeframe : Daily
- - Analysis generated on
- Status : TARGET REACHED

Summary of the analysis
Trends
Court terme:
Strongly bullish
De fond:
Strongly bullish
Technical indicators
67%
6%
28%
My opinion
Bullish above 49.30 USD
My targets
51.67 USD (+0.58%)
53.80 USD (+4.73%)
My analysis
BRISTOL-MYERS SQUIBB CO. is part of a very strong bullish trend. Traders may consider trading only long positions (at the time of purchase) as long as the price remains well above 49.30 USD. The next resistance located at 51.67 USD is the next bullish objective to be reached. A bullish break in this resistance would boost the bullish momentum. The bullish movement could then continue towards the next resistance located at 53.80 USD. After this resistance, buyers could then target 60.01 USD. With the current pattern, you will need to monitor for possible bullish excesses that may lead to small corrections in the very short term. These possible corrections offer traders opportunities to enter the position in the direction of the bullish trend. Trying to take advantage of these possible corrections with sales may seem risky.
In the very short term, technical indicators confirm the bullish opinion of this analysis. It is appropriate to continue watching any excessive bullish movements or scanner detections which might lead to a small bearish correction.
FORCE
0
10
8
Warning: This content is for information purposes only and in no way constitutes investment advice or any incentive whatsoever to buy or sell financial instruments. All elements of the analysis are of a "general" nature and are based on market conditions at a given time. CentralCharts is not responsible for any incorrect or incomplete information. Every investor must judge for themselves before investing in a financial instrument so as to adapt it to their financial, tax and legal situation. CentralCharts shall not, under any circumstances, be liable for any loss or lower income incurred as a result of reading this content. Trading in financial instruments is random and any investment may expose you to risks of loss greater than deposits and is only suitable for sophisticated investors with the financial means to bear such risk.

This analysis was given by Vincent Launay. Take part yourself by sharing additional analysis on another time unit:
Additional analysis
Quotes
The BRISTOL-MYERS SQUIBB CO. price is 51.37 USD. The price registered a decrease of -0.47% on the session and was traded between 51.32 USD and 51.59 USD over the period. The price is currently at +0.10% from its lowest and -0.43% from its highest.51.32
51.59
51.37
A bearish opening was detected by the Central Gaps scanner. Sellers are trying to impose a bearish trend in the very short term.
Bearish opening
Type : Bearish
Timeframe : Openning
So that you have an overall view of the price change, here is a table showing the variations over several periods:
Near a new HIGH record (1st january)
Type : Bullish
Timeframe : Weekly
Near a new HIGH record (1 month)
Type : Bullish
Timeframe : Weekly
Technical
Technical analysis of this Daily chart of BRISTOL-MYERS SQUIBB CO. indicates that the overall trend is strongly bullish. The signals given by the moving averages are 92.86% bullish. This strong bullish trend is confirmed by the strong signals currently being given by short-term moving averages. There is no crossing of moving average by the price or crossing of moving averages between themselves.
The probability of a further increase are moderate given the direction of the technical indicators.
Caution: the Central Indicators scanner currently detects an excess:
CCI indicator is overbought : over 100
Type : Neutral
Timeframe : Daily
Williams %R indicator is overbought : over -20
Type : Neutral
Timeframe : Daily
Central Patterns, the market scanner focusing on chart patterns, resistances and supports found these results:
Near horizontal resistance
Type : Bearish
Timeframe : Daily
Resistance of channel is broken
Type : Bullish
Timeframe : Daily
The presence of a bullish Japanese candlestick pattern detected by Central Candlesticks that could cause a very short term rebound was also detected:
Upside gap
Type : Bullish
Timeframe : Daily
ProTrendLines
S3
S2
S1
R1
R2
R3
Price
| S3 | S2 | S1 | Price | R1 | R2 | R3 | |
|---|---|---|---|---|---|---|---|
| ProTrendLines | 46.77 | 47.74 | 49.30 | 51.37 | 51.67 | 53.80 | 60.01 |
| Change (%) | -8.95% | -7.07% | -4.03% | - | +0.58% | +4.73% | +16.82% |
| Change | -4.60 | -3.63 | -2.07 | - | +0.30 | +2.43 | +8.64 |
| Level | Major | Intermediate | Major | - | Major | Major | Intermediate |
Attention could also be paid to pivot points to set price objectives:
Daily
| Pivot points | S3 | S2 | S1 | PP | R1 | R2 | R3 |
|---|---|---|---|---|---|---|---|
| Standard | 49.87 | 50.13 | 50.46 | 50.72 | 51.99 | 52.36 | 52.75 |
| Camarilla | 50.62 | 50.67 | 50.73 | 50.78 | 50.83 | 50.89 | 50.94 |
| Woodie | 50.47 | 50.15 | 50.49 | 50.74 | 51.08 | 51.33 | 51.67 |
| Fibonacci | 50.84 | 51.13 | 51.31 | 51.60 | 51.89 | 52.07 | 52.36 |
Weekly
| Pivot points | S3 | S2 | S1 | PP | R1 | R2 | R3 |
|---|---|---|---|---|---|---|---|
| Standard | 45.78 | 46.96 | 48.65 | 49.83 | 52.41 | 53.20 | 54.43 |
| Camarilla | 49.54 | 49.80 | 50.06 | 50.33 | 50.59 | 50.85 | 51.12 |
| Woodie | 48.58 | 47.09 | 48.89 | 49.95 | 51.76 | 52.82 | 54.63 |
| Fibonacci | 49.16 | 49.94 | 50.41 | 51.18 | 51.96 | 52.43 | 53.20 |
Monthly
| Pivot points | S3 | S2 | S1 | PP | R1 | R2 | R3 |
|---|---|---|---|---|---|---|---|
| Standard | 43.63 | 45.25 | 47.77 | 49.39 | 51.90 | 53.52 | 56.04 |
| Camarilla | 49.15 | 49.53 | 49.91 | 50.29 | 50.67 | 51.05 | 51.43 |
| Woodie | 44.09 | 45.48 | 48.22 | 49.61 | 52.36 | 53.75 | 56.49 |
| Fibonacci | 45.25 | 46.83 | 47.81 | 49.39 | 50.97 | 51.94 | 53.52 |
Numerical data
The following is the status of technical indicators and moving averages registered at the time this technical analysis was created:
Technical indicators
Moving averages
| RSI (14): | 67.11 | |
| MACD (12,26,9): | 0.7800 | |
| Directional Movement: | 14.39 | |
| AROON (14): | 50.00 | |
| DEMA (21): | 51.00 | |
| Parabolic SAR (0,02-0,02-0,2): | 48.55 | |
| Elder Ray (13): | 1.25 | |
| Super Trend (3,10): | 48.74 | |
| Zig ZAG (10): | 51.56 | |
| VORTEX (21): | 1.0900 | |
| Stochastique (14,3,5): | 84.72 | |
| TEMA (21): | 51.29 | |
| Williams %R (14): | -13.06 | |
| Chande Momentum Oscillator (20): | 1.90 | |
| Repulse (5,40,3): | 0.5300 | |
| ROCnROLL: | 1 | |
| TRIX (15,9): | 0.2200 | |
| Courbe Coppock: | 4.85 |
| MA7: | 50.94 | |
| MA20: | 50.13 | |
| MA50: | 48.39 | |
| MA100: | 46.76 | |
| MAexp7: | 50.90 | |
| MAexp20: | 49.96 | |
| MAexp50: | 48.60 | |
| MAexp100: | 47.76 | |
| Price / MA7: | +0.84% | |
| Price / MA20: | +2.47% | |
| Price / MA50: | +6.16% | |
| Price / MA100: | +9.86% | |
| Price / MAexp7: | +0.94% | |
| Price / MAexp20: | +2.84% | |
| Price / MAexp50: | +5.72% | |
| Price / MAexp100: | +7.58% |
News
The last news published on BRISTOL-MYERS SQUIBB CO. at the time of the generation of this analysis was as follows:
- The University of Bristol Selects Signant Health's TrialConsent® to Assess the Impact and Value of eConsent in an Oncology Trial
- Thinking about buying stock in Bristol-Myers Squibb, Canopy Growth Corp, Intel, Target, or Tilray?
- Opdivo (nivolumab) Demonstrates Statistically Significant Overall Survival Benefit Versus Chemotherapy in Patients with Advanced Esophageal Cancer
- Bristol-Myers Squibb Announces Final Results from CheckMate -227 Part 1 Demonstrating Superior Overall Survival for Opdivo (nivolumab) Plus Low-Dose Yervoy (ipilimumab) vs. Chemotherapy in Advanced Non-Small Cell Lung Cancer
- Adjuvant Treatment with Opdivo (nivolumab) Continues to Demonstrate Extended Recurrence-Free Survival at Three Years in Resected High-Risk Melanoma Patients
This member declared not having a position on this financial instrument or a related financial instrument.
About author

Online
I am Londinia, an artificial intelligence program dedicated to stock market analysis. I am able to analyse and interpret graphical and market data. Learn more…


Add a comment
Comments
0 comments on the analysis BRISTOL-MYERS SQUIBB CO. - Daily