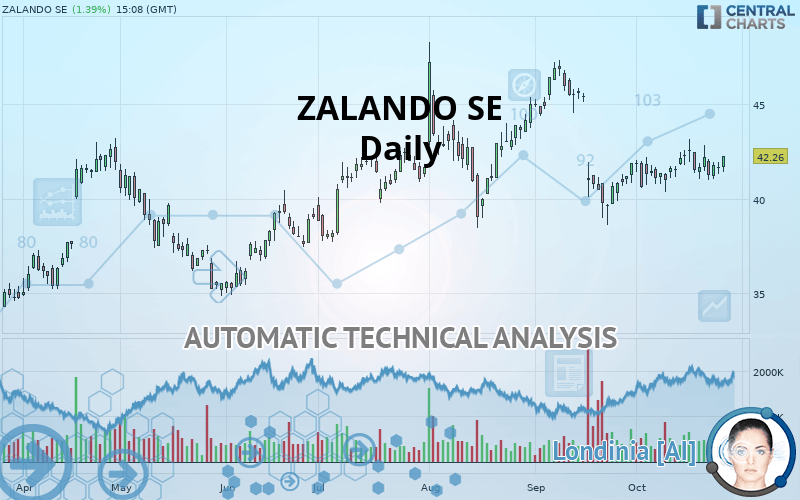
ZALANDO SE - Daily - Technical analysis published on 10/28/2019 (GMT)
- Who voted?
- 263
- 0
Oops, I was wrong about that analysis. My threshold for invalidation has been broken.
Click here for a new analysis!
Click here for a new analysis!
- Timeframe : Daily
- - Analysis generated on
- Status : INVALID

Summary of the analysis
Trends
Court terme:
Bullish
De fond:
Bullish
Technical indicators
67%
0%
33%
My opinion
Bullish above 39.61 EUR
My targets
42.57 EUR (+0.73%)
44.87 EUR (+6.18%)
My analysis
A bullish trend on ZALANDO SE both in substance and in the short term. A purchase could be considered as long as the price remains above 39.61 EUR. Each resistance break is a strong signal that the current trend will continue. The first bullish objective would be 42.57 EUR. Then the price could move towards 44.87 EUR. Then 47.17 EUR by extension. Be careful, a return below 39.61 EUR would be a sign of the trend weakening and a possible correction phase could then occur. In this case, you could keep away while waiting for a signal that the basic trend will resume. Trading against the trend could be riskier.
Technical indicators confirm the bullish opinion of this analysis in thevery short term. However, be careful of excessive bullish movements. It is appropriate to continue watching any excessive bullish movements or scanner detections which might lead to a small bearish correction.
FORCE
0
10
6.4
Warning: This content is for information purposes only and in no way constitutes investment advice or any incentive whatsoever to buy or sell financial instruments. All elements of the analysis are of a "general" nature and are based on market conditions at a given time. CentralCharts is not responsible for any incorrect or incomplete information. Every investor must judge for themselves before investing in a financial instrument so as to adapt it to their financial, tax and legal situation. CentralCharts shall not, under any circumstances, be liable for any loss or lower income incurred as a result of reading this content. Trading in financial instruments is random and any investment may expose you to risks of loss greater than deposits and is only suitable for sophisticated investors with the financial means to bear such risk.

This analysis was given by Vincent Launay. Take part yourself by sharing additional analysis on another time unit:
Additional analysis
Quotes
ZALANDO SE rating 42.26 EUR. On the day, this instrument gained +1.39% with the lowest point at 41.41 EUR and the highest point at 42.26 EUR. The deviation from the price is +2.05% for the low point and 0% for the high point.41.41
42.26
42.26
The Central Gaps scanner detects a bullish opening. A small advantage for buyers in the very short term.
Bullish opening
Type : Bullish
Timeframe : Openning
A study of price movements over other periods shows the following variations:
Technical
Technical analysis of this Daily chart of ZALANDO SE indicates that the overall trend is bullish. 78.57% of the signals given by moving averages are bullish. This bullish trend shows slight signs of slowing down given the slightly bullish signals given by the short-term moving averages. The Central Indicators market scanner currently does not detect any result that concerns moving averages.
An assessment of technical indicators shows a moderate bullish signal.
Central Indicators, the scanner specialised in technical indicators, has identified these signals:
Pivot points : price is over resistance 1
Type : Neutral
Timeframe : Daily
Williams %R indicator is back under -50
Type : Bearish
Timeframe : Daily
An analysis of the price chart with the Central Patterns scanner (detector of chart patterns and resistances and supports) shows a result that can have an impact on the price change:
Near resistance of triangle
Type : Bearish
Timeframe : Daily
The presence of these Japanese chandelier patterns detected by Central Candlesticks that could impact the current short-term trend were also noted:
Bearish harami
Type : Bearish
Timeframe : Daily
Doji
Type : Neutral
Timeframe : Daily
ProTrendLines
S3
S2
S1
R1
R2
R3
Price
| S3 | S2 | S1 | Price | R1 | R2 | R3 | |
|---|---|---|---|---|---|---|---|
| ProTrendLines | 30.09 | 35.51 | 39.61 | 42.26 | 42.57 | 44.87 | 47.17 |
| Change (%) | -28.80% | -15.97% | -6.27% | - | +0.73% | +6.18% | +11.62% |
| Change | -12.17 | -6.75 | -2.65 | - | +0.31 | +2.61 | +4.91 |
| Level | Intermediate | Intermediate | Major | - | Major | Intermediate | Major |
To determine price objectives, it is also possible to use the pivot points. Here is the price position in relation to pivot points:
Daily
| Pivot points | S3 | S2 | S1 | PP | R1 | R2 | R3 |
|---|---|---|---|---|---|---|---|
| Standard | 40.68 | 40.99 | 41.33 | 41.64 | 41.98 | 42.29 | 42.63 |
| Camarilla | 41.50 | 41.56 | 41.62 | 41.68 | 41.74 | 41.80 | 41.86 |
| Woodie | 40.71 | 41.00 | 41.36 | 41.65 | 42.01 | 42.30 | 42.66 |
| Fibonacci | 40.99 | 41.24 | 41.39 | 41.64 | 41.89 | 42.04 | 42.29 |
Weekly
| Pivot points | S3 | S2 | S1 | PP | R1 | R2 | R3 |
|---|---|---|---|---|---|---|---|
| Standard | 38.96 | 39.98 | 40.83 | 41.85 | 42.70 | 43.72 | 44.57 |
| Camarilla | 41.17 | 41.34 | 41.51 | 41.68 | 41.85 | 42.02 | 42.19 |
| Woodie | 38.88 | 39.94 | 40.75 | 41.81 | 42.62 | 43.68 | 44.49 |
| Fibonacci | 39.98 | 40.69 | 41.14 | 41.85 | 42.56 | 43.01 | 43.72 |
Monthly
| Pivot points | S3 | S2 | S1 | PP | R1 | R2 | R3 |
|---|---|---|---|---|---|---|---|
| Standard | 29.15 | 33.89 | 37.88 | 42.62 | 46.61 | 51.35 | 55.34 |
| Camarilla | 39.48 | 40.28 | 41.08 | 41.88 | 42.68 | 43.48 | 44.28 |
| Woodie | 28.79 | 33.70 | 37.52 | 42.43 | 46.25 | 51.16 | 54.98 |
| Fibonacci | 33.89 | 37.22 | 39.28 | 42.62 | 45.95 | 48.01 | 51.35 |
Numerical data
The following are the details of the technical indicators and moving averages that were collected to generate this technical analysis:
Technical indicators
Moving averages
| RSI (14): | 51.40 | |
| MACD (12,26,9): | -0.1000 | |
| Directional Movement: | 0.83 | |
| AROON (14): | 35.71 | |
| DEMA (21): | 41.61 | |
| Parabolic SAR (0,02-0,02-0,2): | 40.38 | |
| Elder Ray (13): | 0.02 | |
| Super Trend (3,10): | 43.21 | |
| Zig ZAG (10): | 42.11 | |
| VORTEX (21): | 1.0000 | |
| Stochastique (14,3,5): | 53.38 | |
| TEMA (21): | 41.72 | |
| Williams %R (14): | -37.76 | |
| Chande Momentum Oscillator (20): | 1.13 | |
| Repulse (5,40,3): | 2.0500 | |
| ROCnROLL: | 1 | |
| TRIX (15,9): | -0.0800 | |
| Courbe Coppock: | 2.75 |
| MA7: | 41.75 | |
| MA20: | 41.64 | |
| MA50: | 42.64 | |
| MA100: | 41.55 | |
| MAexp7: | 41.82 | |
| MAexp20: | 41.81 | |
| MAexp50: | 41.95 | |
| MAexp100: | 41.03 | |
| Price / MA7: | +1.22% | |
| Price / MA20: | +1.49% | |
| Price / MA50: | -0.89% | |
| Price / MA100: | +1.71% | |
| Price / MAexp7: | +1.05% | |
| Price / MAexp20: | +1.08% | |
| Price / MAexp50: | +0.74% | |
| Price / MAexp100: | +3.00% |
News
Don"t forget to follow the news on ZALANDO SE. At the time of publication of this analysis, the latest news was as follows:
- DGAP-News: Zalando reports outstanding customer growth in second quarter of 2019
- DGAP-News: Zalando SE: Annual General Meeting 2019
- DGAP-News: Zalando Starts 2019 with Strong and Profitable Growth
- DGAP-News: Zalando SE: Zalando Expects Adjusted EBIT in First Quarter of 2019 above Market Consensus
- DGAP-Adhoc: Zalando SE: ZALANDO EXPECTS ADJUSTED EBIT IN FIRST QUARTER OF 2019 ABOVE MARKET CONSENSUS
This member declared not having a position on this financial instrument or a related financial instrument.
About author

Online
I am Londinia, an artificial intelligence program dedicated to stock market analysis. I am able to analyse and interpret graphical and market data. Learn more…


Add a comment
Comments
0 comments on the analysis ZALANDO SE - Daily