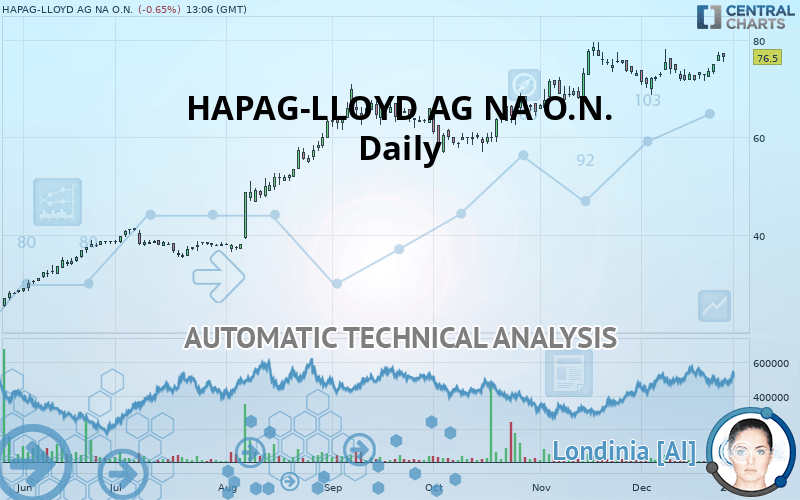
HAPAG-LLOYD AG NA O.N. - Daily - Technical analysis published on 12/31/2019 (GMT)
- Who voted?
- 300
- 0
Click here for a new analysis!
- Timeframe : Daily
- - Analysis generated on
- Status : TARGET REACHED

Summary of the analysis

Additional analysis
Quotes
The HAPAG-LLOYD AG NA O.N. price is 76.5 EUR. The price is lower by -0.65% since the last closing and was traded between 75.5 EUR and 77.4 EUR over the period. The price is currently at +1.32% from its lowest and -1.16% from its highest.A study of price movements over other periods shows the following variations:
Near a new HIGH record (1 year)
Type : Bullish
Timeframe : Weekly
Near a new HIGH record (1st january)
Type : Bullish
Timeframe : Weekly
Near a new HIGH record (1 month)
Type : Bullish
Timeframe : Weekly
Technical
Technical analysis of this Daily chart of HAPAG-LLOYD AG NA O.N. indicates that the overall trend is strongly bullish. 92.86% of the signals given by moving averages are bullish. This strongly bullish trend is supported by the strong bullish signals given by short-term moving averages. An assessment of moving averages reveals a bullish signal that could impact this trend:
Bullish trend reversal : Moving Average 20
Type : Bullish
Timeframe : Daily
In fact, according to the parameters integrated into the Central Analyzer system, 14 technical indicators out of 18 analysed are currently bullish. But beware of excesses. The Central Indicators scanner currently detects this:
CCI indicator is overbought : over 100
Type : Neutral
Timeframe : Daily
Williams %R indicator is overbought : over -20
Type : Neutral
Timeframe : Daily
MACD crosses UP its Moving Average
Type : Bullish
Timeframe : Daily
Ichimoku - Bullish crossover : Tenkan & Kijun
Type : Bullish
Timeframe : Daily
Price is back over the pivot point
Type : Bullish
Timeframe : Daily
Price is back over the pivot point
Type : Bullish
Timeframe : Weekly
Central Patterns, the scanner specializing in chart patterns, did not identify any signals.
The presence of a bullish Japanese candlestick pattern detected by Central Candlesticks that could cause a very short term rebound was also detected:
Upside gap
Type : Bullish
Timeframe : Daily
| S3 | S2 | S1 | Price | R1 | |
|---|---|---|---|---|---|
| ProTrendLines | 37.4 | 58.8 | 70.0 | 76.5 | 78.5 |
| Change (%) | -51.11% | -23.14% | -8.50% | - | +2.61% |
| Change | -39.1 | -17.7 | -6.5 | - | +2.0 |
| Level | Major | Major | Intermediate | - | Major |
Pivot points can also be used to set your price objectives. Here is the price situation in relation to pivot points:
| Pivot points | S3 | S2 | S1 | PP | R1 | R2 | R3 |
|---|---|---|---|---|---|---|---|
| Standard | 73.9 | 74.7 | 75.9 | 76.7 | 77.9 | 78.7 | 79.9 |
| Camarilla | 76.5 | 76.6 | 76.8 | 77.0 | 77.2 | 77.4 | 77.6 |
| Woodie | 74.0 | 74.8 | 76.0 | 76.8 | 78.0 | 78.8 | 80.0 |
| Fibonacci | 74.7 | 75.5 | 76.0 | 76.7 | 77.5 | 78.0 | 78.7 |
| Pivot points | S3 | S2 | S1 | PP | R1 | R2 | R3 |
|---|---|---|---|---|---|---|---|
| Standard | 69.5 | 71.3 | 74.1 | 75.9 | 78.7 | 80.5 | 83.3 |
| Camarilla | 75.7 | 76.2 | 76.6 | 77.0 | 77.4 | 77.8 | 78.3 |
| Woodie | 70.1 | 71.6 | 74.7 | 76.2 | 79.3 | 80.8 | 83.9 |
| Fibonacci | 71.3 | 73.0 | 74.1 | 75.9 | 77.6 | 78.7 | 80.5 |
| Pivot points | S3 | S2 | S1 | PP | R1 | R2 | R3 |
|---|---|---|---|---|---|---|---|
| Standard | 52.3 | 59.1 | 66.1 | 72.9 | 79.9 | 86.7 | 93.7 |
| Camarilla | 69.4 | 70.7 | 71.9 | 73.2 | 74.5 | 75.7 | 77.0 |
| Woodie | 52.5 | 59.2 | 66.3 | 73.0 | 80.1 | 86.8 | 93.9 |
| Fibonacci | 59.1 | 64.3 | 67.6 | 72.9 | 78.1 | 81.4 | 86.7 |
Numerical data
The following is the status of the technical indicators and moving averages at the time of publication of this technical analysis:
| RSI (14): | 61.50 | |
| MACD (12,26,9): | 1.1000 | |
| Directional Movement: | 14.1 | |
| AROON (14): | -57.1 | |
| DEMA (21): | 75.2 | |
| Parabolic SAR (0,02-0,02-0,2): | 70.8 | |
| Elder Ray (13): | 2.3 | |
| Super Trend (3,10): | 69.9 | |
| Zig ZAG (10): | 76.5 | |
| VORTEX (21): | 1.0000 | |
| Stochastique (14,3,5): | 74.20 | |
| TEMA (21): | 74.8 | |
| Williams %R (14): | -25.40 | |
| Chande Momentum Oscillator (20): | 1.0 | |
| Repulse (5,40,3): | 2.8000 | |
| ROCnROLL: | 1 | |
| TRIX (15,9): | 0.2000 | |
| Courbe Coppock: | 4.50 |
| MA7: | 74.4 | |
| MA20: | 73.4 | |
| MA50: | 71.1 | |
| MA100: | 65.5 | |
| MAexp7: | 75.0 | |
| MAexp20: | 73.7 | |
| MAexp50: | 70.7 | |
| MAexp100: | 64.0 | |
| Price / MA7: | +2.82% | |
| Price / MA20: | +4.22% | |
| Price / MA50: | +7.59% | |
| Price / MA100: | +16.79% | |
| Price / MAexp7: | +2.00% | |
| Price / MAexp20: | +3.80% | |
| Price / MAexp50: | +8.20% | |
| Price / MAexp100: | +19.53% |
News
The last news published on HAPAG-LLOYD AG NA O.N. at the time of the generation of this analysis was as follows:
- DGAP-News: Hapag-Lloyd AG: Hapag-Lloyd doubles operational result in the first nine months
- DGAP-News: Hapag-Lloyd AG: Mark Frese to become new CFO of Hapag-Lloyd
- DGAP-News: Hapag-Lloyd AG: Hapag-Lloyd delivers significantly higher half-year result
- DGAP-News: Hapag-Lloyd AG: Change in core shareholders' stake in Hapag-Lloyd AG
- DGAP-News: Hapag-Lloyd AG: Hapag-Lloyd decides full redemption of senior note prior to maturity
About author

Online


Add a comment
Comments
0 comments on the analysis HAPAG-LLOYD AG NA O.N. - Daily