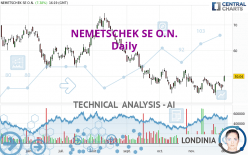
NEMETSCHEK SE O.N. - Daily - Technical analysis published on 12/01/2022 (GMT)
- 118
- 0
Click here for a new analysis!
- Timeframe : Daily
- - Analysis generated on
- Status : TARGET REACHED

Summary of the analysis

Additional analysis
Quotes
NEMETSCHEK SE O.N. rating 50.04 EUR. On the day, this instrument gained +7.38% and was between 48.11 EUR and 50.40 EUR. This implies that the price is at +4.01% from its lowest and at -0.71% from its highest.The Central Gaps scanner detects the formation of a bullish gap marking the strong presence of buyers against sellers at the opening. This formed a quotation gap.
Opening Gap UP
Type : Bullish
Timeframe : Openning
So that you have an overall view of the price change, here is a table showing the variations over several periods:
New HIGH record (1 month)
Type : Bullish
Timeframe : Weekly
Technical
Technical analysis of NEMETSCHEK SE O.N. in Daily shows a neutral overall trend. The strong bullish signals currently being given by short-term moving averages could allow the overall trend to return to bullish. An assessment of moving averages reveals several bullish signals that could impact this trend:
Bullish price crossover with Moving Average 50
Type : Bullish
Timeframe : Daily
Bullish price crossover with adaptative moving average 20
Type : Bullish
Timeframe : Daily
Bullish price crossover with adaptative moving average 50
Type : Bullish
Timeframe : Daily
Technical indicators are strongly bullish, suggesting that the price increase should continue.
Caution: the Central Indicators scanner currently detects an excess:
CCI indicator is overbought : over 100
Type : Neutral
Timeframe : Daily
Williams %R indicator is overbought : over -20
Type : Neutral
Timeframe : Daily
Pivot points : price is over resistance 1
Type : Neutral
Timeframe : Weekly
Pivot points : price is over resistance 3
Type : Neutral
Timeframe : Daily
RSI indicator is back over 50
Type : Bullish
Timeframe : Daily
Aroon indicator bullish trend
Type : Bullish
Timeframe : Daily
Momentum indicator is back over 0
Type : Bullish
Timeframe : Daily
The analysis of the price chart with Central Patterns scanners does not return any result.
Central Candlesticks, the scanner specialised in Japanese candlesticks, detects a bullish signal that could support the hypothesis of a small rebound in the very short term:
Upside gap
Type : Bullish
Timeframe : Daily
| S3 | S2 | S1 | Price | R1 | R2 | R3 | |
|---|---|---|---|---|---|---|---|
| ProTrendLines | 23.57 | 35.08 | 44.69 | 50.04 | 50.96 | 61.27 | 70.46 |
| Change (%) | -52.90% | -29.90% | -10.69% | - | +1.84% | +22.44% | +40.81% |
| Change | -26.47 | -14.96 | -5.35 | - | +0.92 | +11.23 | +20.42 |
| Level | Minor | Major | Major | - | Major | Intermediate | Major |
Pivot points can also be used to set your price objectives. Here is the price situation in relation to pivot points:
| Pivot points | S3 | S2 | S1 | PP | R1 | R2 | R3 |
|---|---|---|---|---|---|---|---|
| Standard | 44.74 | 45.25 | 45.92 | 46.43 | 47.10 | 47.61 | 48.28 |
| Camarilla | 46.28 | 46.38 | 46.49 | 46.60 | 46.71 | 46.82 | 46.93 |
| Woodie | 44.83 | 45.29 | 46.01 | 46.47 | 47.19 | 47.65 | 48.37 |
| Fibonacci | 45.25 | 45.70 | 45.98 | 46.43 | 46.88 | 47.16 | 47.61 |
| Pivot points | S3 | S2 | S1 | PP | R1 | R2 | R3 |
|---|---|---|---|---|---|---|---|
| Standard | 39.12 | 40.95 | 44.42 | 46.25 | 49.72 | 51.55 | 55.02 |
| Camarilla | 46.43 | 46.92 | 47.40 | 47.89 | 48.38 | 48.86 | 49.35 |
| Woodie | 39.94 | 41.36 | 45.24 | 46.66 | 50.54 | 51.96 | 55.84 |
| Fibonacci | 40.95 | 42.98 | 44.23 | 46.25 | 48.28 | 49.53 | 51.55 |
| Pivot points | S3 | S2 | S1 | PP | R1 | R2 | R3 |
|---|---|---|---|---|---|---|---|
| Standard | 35.51 | 39.15 | 42.87 | 46.51 | 50.23 | 53.87 | 57.59 |
| Camarilla | 44.58 | 45.25 | 45.93 | 46.60 | 47.28 | 47.95 | 48.62 |
| Woodie | 35.56 | 39.17 | 42.92 | 46.53 | 50.28 | 53.89 | 57.64 |
| Fibonacci | 39.15 | 41.96 | 43.70 | 46.51 | 49.32 | 51.06 | 53.87 |
Numerical data
The following is the status of the technical indicators and moving averages at the time of publication of this technical analysis:
| RSI (14): | 57.74 | |
| MACD (12,26,9): | -0.2700 | |
| Directional Movement: | 2.59 | |
| AROON (14): | 42.86 | |
| DEMA (21): | 46.66 | |
| Parabolic SAR (0,02-0,02-0,2): | 43.19 | |
| Elder Ray (13): | 2.09 | |
| Super Trend (3,10): | 50.55 | |
| Zig ZAG (10): | 50.16 | |
| VORTEX (21): | 0.9700 | |
| Stochastique (14,3,5): | 63.25 | |
| TEMA (21): | 47.40 | |
| Williams %R (14): | -4.72 | |
| Chande Momentum Oscillator (20): | 1.87 | |
| Repulse (5,40,3): | 4.7500 | |
| ROCnROLL: | 1 | |
| TRIX (15,9): | -0.1800 | |
| Courbe Coppock: | 0.96 |
| MA7: | 47.34 | |
| MA20: | 46.77 | |
| MA50: | 47.96 | |
| MA100: | 54.64 | |
| MAexp7: | 47.40 | |
| MAexp20: | 47.24 | |
| MAexp50: | 49.14 | |
| MAexp100: | 53.64 | |
| Price / MA7: | +5.70% | |
| Price / MA20: | +6.99% | |
| Price / MA50: | +4.34% | |
| Price / MA100: | -8.42% | |
| Price / MAexp7: | +5.57% | |
| Price / MAexp20: | +5.93% | |
| Price / MAexp50: | +1.83% | |
| Price / MAexp100: | -6.71% |
News
The last news published on NEMETSCHEK SE O.N. at the time of the generation of this analysis was as follows:
- EQS-News: Nemetschek Group announces Louise Öfverström as new CFO
- EQS-News: Nemetschek SE: Continued Double-Digit Growth in Q3 2022 Driven by High Demand for Subscription and SaaS
- Bluebeam Introduces Bluebeam Cloud: Designed for the Business of Building
- DGAP-News: Nemetschek Group appoints new Chief Division Officer for Operate & Manage and Digital Twin
- DGAP-News: Nemetschek Group continues its strong double-digit growth in revenue and profitability in Q2 2022 and confirms its outlook for 2022
About author
Online


Add a comment
Comments
0 comments on the analysis NEMETSCHEK SE O.N. - Daily