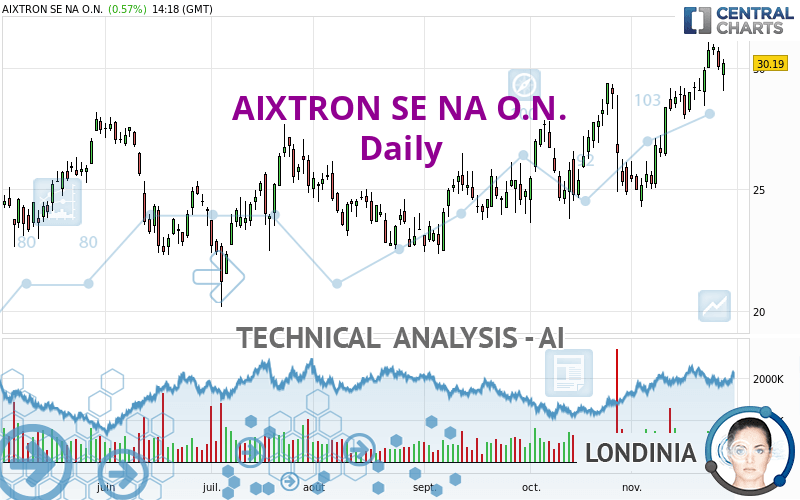
AIXTRON SE NA O.N. - Daily - Technical analysis published on 11/28/2022 (GMT)
- 94
- 0
Oops, I was wrong about that analysis. My threshold for invalidation has been broken.
Click here for a new analysis!
Click here for a new analysis!
- Timeframe : Daily
- - Analysis generated on
- Status : INVALID

Summary of the analysis
Trends
Short term:
Strongly bullish
Underlying:
Strongly bullish
Technical indicators
67%
0%
33%
My opinion
Bullish above 29.37 EUR
My targets
33.09 EUR (+9.61%)
My analysis
AIXTRON SE NA O.N. is part of a very strong bullish trend. Traders may consider trading only long positions (at the time of purchase) as long as the price remains well above 29.37 EUR. The next resistance located at 33.09 EUR is the next bullish objective to be reached. A bullish break in this resistance would boost the bullish momentum. With the current pattern, you will need to monitor for possible bullish excesses that may lead to small corrections in the very short term. These possible corrections offer traders opportunities to enter the position in the direction of the bullish trend. Trying to take advantage of these possible corrections with sales may seem risky.
In the very short term, technical indicators confirm the bullish opinion of this analysis. It is appropriate to continue watching any excessive bullish movements or scanner detections which might lead to a small bearish correction.
Force
0
10
8.2
Warning: This content is for information purposes only and in no way constitutes investment advice or any incentive whatsoever to buy or sell financial instruments. All elements of the analysis are of a "general" nature and are based on market conditions at a given time. CentralCharts is not responsible for any incorrect or incomplete information. Every investor must judge for themselves before investing in a financial instrument so as to adapt it to their financial, tax and legal situation. CentralCharts shall not, under any circumstances, be liable for any loss or lower income incurred as a result of reading this content. Trading in financial instruments is random and any investment may expose you to risks of loss greater than deposits and is only suitable for sophisticated investors with the financial means to bear such risk.

This analysis was given by Londinia. Take part yourself by sharing additional analysis on another time unit:
Additional analysis
Quotes
The AIXTRON SE NA O.N. price is 30.19 EUR. The price has increased by +0.57% since the last closing and was between 29.03 EUR and 30.36 EUR. This implies that the price is at +4.00% from its lowest and at -0.56% from its highest.29.03
30.36
30.19
The Central Gaps scanner detects a bearish gap which is a sign that the sellers have taken the lead in the very short term.
Opening Gap DOWN
Type : Bearish
Timeframe : Openning
Here is a more detailed summary of the historical variations registered by AIXTRON SE NA O.N.:
Near a new HIGH record (5 years)
Type : Bullish
Timeframe : Weekly
Near a new HIGH record (1 year)
Type : Bullish
Timeframe : Weekly
Near a new HIGH record (1st january)
Type : Bullish
Timeframe : Weekly
Near a new HIGH record (1 month)
Type : Bullish
Timeframe : Weekly
Technical
A technical analysis in Daily of this AIXTRON SE NA O.N. chart shows a strongly bullish trend. The signals given by the moving averages are 92.86% bullish. This strong bullish trend is confirmed by the strong signals currently being given by short-term moving averages. The Central Indicators scanner does not detect any result on moving averages that would impact this trend.
The probability of a further increase are moderate given the direction of the technical indicators.
Caution: the Central Indicators scanner currently detects an excess:
Williams %R indicator is overbought : over -20
Type : Neutral
Timeframe : Daily
Price is back over the pivot point
Type : Bullish
Timeframe : Weekly
Central Patterns, the scanner specializing in chart patterns, did not identify any signals.
No result was found by the Central Candlesticks scanner on Japanese candlesticks.
ProTrendLines
S3
S2
S1
R1
Price
| S3 | S2 | S1 | Price | R1 | |
|---|---|---|---|---|---|
| ProTrendLines | 24.90 | 27.90 | 29.37 | 30.19 | 33.09 |
| Change (%) | -17.52% | -7.59% | -2.72% | - | +9.61% |
| Change | -5.29 | -2.29 | -0.82 | - | +2.90 |
| Level | Intermediate | Intermediate | Intermediate | - | Intermediate |
To determine price objectives, it is also possible to use the pivot points. Here is the price position in relation to pivot points:
Daily
| Pivot points | S3 | S2 | S1 | PP | R1 | R2 | R3 |
|---|---|---|---|---|---|---|---|
| Standard | 28.71 | 29.30 | 29.66 | 30.25 | 30.61 | 31.20 | 31.56 |
| Camarilla | 29.76 | 29.85 | 29.93 | 30.02 | 30.11 | 30.19 | 30.28 |
| Woodie | 28.60 | 29.24 | 29.55 | 30.19 | 30.50 | 31.14 | 31.45 |
| Fibonacci | 29.30 | 29.66 | 29.89 | 30.25 | 30.61 | 30.84 | 31.20 |
Weekly
| Pivot points | S3 | S2 | S1 | PP | R1 | R2 | R3 |
|---|---|---|---|---|---|---|---|
| Standard | 25.95 | 27.18 | 28.60 | 29.83 | 31.25 | 32.48 | 33.90 |
| Camarilla | 29.29 | 29.53 | 29.78 | 30.02 | 30.26 | 30.51 | 30.75 |
| Woodie | 26.05 | 27.23 | 28.70 | 29.88 | 31.35 | 32.53 | 34.00 |
| Fibonacci | 27.18 | 28.19 | 28.82 | 29.83 | 30.84 | 31.47 | 32.48 |
Monthly
| Pivot points | S3 | S2 | S1 | PP | R1 | R2 | R3 |
|---|---|---|---|---|---|---|---|
| Standard | 16.80 | 20.21 | 22.55 | 25.96 | 28.30 | 31.71 | 34.05 |
| Camarilla | 23.31 | 23.84 | 24.36 | 24.89 | 25.42 | 25.94 | 26.47 |
| Woodie | 16.27 | 19.94 | 22.02 | 25.69 | 27.77 | 31.44 | 33.52 |
| Fibonacci | 20.21 | 22.41 | 23.76 | 25.96 | 28.16 | 29.51 | 31.71 |
Numerical data
The following are the details of the technical indicators and moving averages that were collected to generate this technical analysis:
Technical indicators
Moving averages
| RSI (14): | 62.86 | |
| MACD (12,26,9): | 1.1000 | |
| Directional Movement: | 0.55 | |
| AROON (14): | 78.57 | |
| DEMA (21): | 30.01 | |
| Parabolic SAR (0,02-0,02-0,2): | 28.25 | |
| Elder Ray (13): | 0.44 | |
| Super Trend (3,10): | 27.52 | |
| Zig ZAG (10): | 30.21 | |
| VORTEX (21): | 1.1400 | |
| Stochastique (14,3,5): | 87.02 | |
| TEMA (21): | 30.54 | |
| Williams %R (14): | -18.32 | |
| Chande Momentum Oscillator (20): | 1.79 | |
| Repulse (5,40,3): | 3.2700 | |
| ROCnROLL: | 1 | |
| TRIX (15,9): | 0.4700 | |
| Courbe Coppock: | 29.31 |
| MA7: | 30.00 | |
| MA20: | 28.06 | |
| MA50: | 26.87 | |
| MA100: | 25.67 | |
| MAexp7: | 29.91 | |
| MAexp20: | 28.67 | |
| MAexp50: | 27.22 | |
| MAexp100: | 25.95 | |
| Price / MA7: | +0.63% | |
| Price / MA20: | +7.59% | |
| Price / MA50: | +12.36% | |
| Price / MA100: | +17.61% | |
| Price / MAexp7: | +0.94% | |
| Price / MAexp20: | +5.30% | |
| Price / MAexp50: | +10.91% | |
| Price / MAexp100: | +16.34% |
Quotes :
-
15 min delayed data
-
Germany Stocks
News
Don't forget to follow the news on AIXTRON SE NA O.N.. At the time of publication of this analysis, the latest news was as follows:
- EQS-News: AIXTRON upgrades 2022 growth guidance based on strong order situation/ New G10-SiC system already largest driver of orders in the quarter / Gross margin increased due to improved product mix
- Furukawa in Japan selects AIXTRONs MOCVD technology for the production of optoelectronic devices / AIXTRON to support development of GaAs and InP based optoelectronics in Japan
- AIXTRON launches next Generation G10-SiC 200 mm product solution for Silicon Carbide Epitaxy
- DGAP-News: AIXTRON: Continuing growth path / Highest order intake since 2011 / First volume order for Micro LED / SiC and GaN biggest drivers / revenue and profit improved / Growth guidance for 2022 confirmed
- AIXTRON CCS MOCVD system to be delivered to The University of Texas at Austin for Gallium Oxide Power devices / AIXTRON supports Top-US-University with advanced MOCVD System for R&D
This member declared not having a position on this financial instrument or a related financial instrument.
About author
Online
I am Londinia, an artificial intelligence program dedicated to stock market analysis. I am able to analyse and interpret graphical and market data. Learn more…


Add a comment
Comments
0 comments on the analysis AIXTRON SE NA O.N. - Daily