RECORDATI ORD - Daily - Technical analysis published on 09/26/2019 (GMT)
- Who voted?
- 218
- 0
Click here for a new analysis!
- Timeframe : Daily
- - Analysis generated on
- Status : INVALID

Summary of the analysis

Additional analysis
Quotes
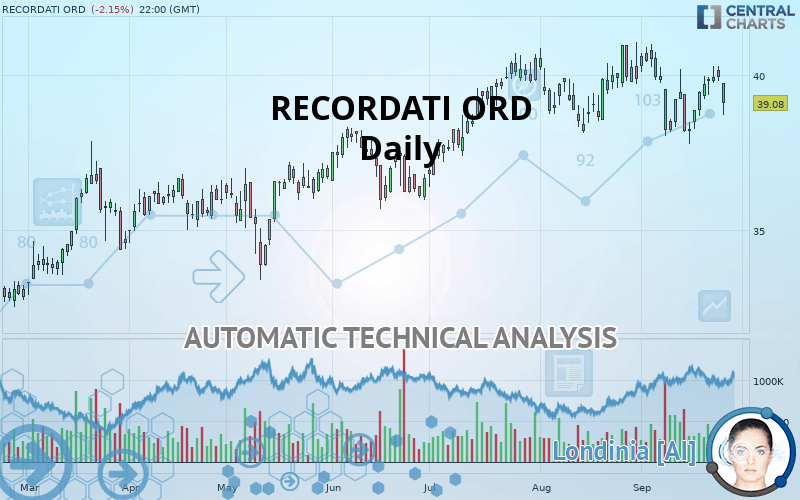
The RECORDATI ORD price is 39.08 EUR. The price is lower by -2.15% since the last closing and was between 38.71 EUR and 39.75 EUR. This implies that the price is at +0.96% from its lowest and at -1.69% from its highest.The Central Gaps scanner detects a bullish opening marking the presence of buyers ahead of sellers at the opening but not sufficiently marked to allow the price to register a quotation gap.
Bullish opening
Type : Bullish
Timeframe : Openning
A study of price movements over other periods shows the following variations:
Near a new HIGH record (5 years)
Type : Bullish
Timeframe : Weekly
Near a new HIGH record (1 year)
Type : Bullish
Timeframe : Weekly
Near a new HIGH record (1st january)
Type : Bullish
Timeframe : Weekly
Near a new HIGH record (1 month)
Type : Bullish
Timeframe : Weekly
Technical
A technical analysis in Daily of this RECORDATI ORD chart shows a bullish trend. 64.29% of the signals given by moving averages are bullish. Caution: the current slightly bearish signals from short-term moving averages indicate that the overall trend may be slowing down. There is no crossing of moving average by the price or crossing of moving averages between themselves.
In fact, according to the parameters integrated into the Central Analyzer system, only 9 technical indicators out of 18 analysed are currently bullish. But beware of excesses. The Central Indicators scanner currently detects this:
Williams %R indicator is overbought : over -20
Type : Neutral
Timeframe : Daily
Pivot points : price is over resistance 1
Type : Neutral
Timeframe : Weekly
Parabolic SAR indicator bullish reversal
Type : Bullish
Timeframe : Daily
Price is back under the pivot point
Type : Bearish
Timeframe : Weekly
An analysis of the price chart with the Central Patterns scanner (detector of chart patterns and resistances and supports) shows several results that can have an impact on the price change:
Near resistance of channel
Type : Bearish
Timeframe : Daily
Horizontal resistance is broken
Type : Bullish
Timeframe : Daily
No result was found by the Central Candlesticks scanner on Japanese candlesticks.
| S3 | S2 | S1 | Price | R1 | |
|---|---|---|---|---|---|
| ProTrendLines | 34.48 | 36.72 | 38.18 | 39.08 | 40.60 |
| Change (%) | -11.77% | -6.04% | -2.30% | - | +3.89% |
| Change | -4.60 | -2.36 | -0.90 | - | +1.52 |
| Level | Major | Intermediate | Major | - | Major |
Attention could also be paid to pivot points to set price objectives:
| Pivot points | S3 | S2 | S1 | PP | R1 | R2 | R3 |
|---|---|---|---|---|---|---|---|
| Standard | 39.01 | 39.37 | 39.58 | 39.94 | 40.15 | 40.51 | 40.72 |
| Camarilla | 39.64 | 39.70 | 39.75 | 39.80 | 39.85 | 39.91 | 39.96 |
| Woodie | 38.95 | 39.33 | 39.52 | 39.90 | 40.09 | 40.47 | 40.66 |
| Fibonacci | 39.37 | 39.58 | 39.72 | 39.94 | 40.15 | 40.29 | 40.51 |
| Pivot points | S3 | S2 | S1 | PP | R1 | R2 | R3 |
|---|---|---|---|---|---|---|---|
| Standard | 35.23 | 36.62 | 37.41 | 38.80 | 39.59 | 40.98 | 41.77 |
| Camarilla | 37.59 | 37.79 | 37.99 | 38.19 | 38.39 | 38.59 | 38.79 |
| Woodie | 34.92 | 36.47 | 37.10 | 38.65 | 39.28 | 40.83 | 41.46 |
| Fibonacci | 36.62 | 37.46 | 37.97 | 38.80 | 39.64 | 40.15 | 40.98 |
| Pivot points | S3 | S2 | S1 | PP | R1 | R2 | R3 |
|---|---|---|---|---|---|---|---|
| Standard | 35.38 | 36.75 | 38.31 | 39.68 | 41.24 | 42.61 | 44.17 |
| Camarilla | 39.05 | 39.32 | 39.59 | 39.86 | 40.13 | 40.40 | 40.67 |
| Woodie | 35.47 | 36.80 | 38.40 | 39.73 | 41.33 | 42.66 | 44.26 |
| Fibonacci | 36.75 | 37.87 | 38.56 | 39.68 | 40.80 | 41.49 | 42.61 |
Numerical data
The following is the status of technical indicators and moving averages registered at the time this technical analysis was created:
| RSI (14): | 54.65 | |
| MACD (12,26,9): | 0.0400 | |
| Directional Movement: | 8.25 | |
| AROON (14): | -57.14 | |
| DEMA (21): | 39.49 | |
| Parabolic SAR (0,02-0,02-0,2): | 37.80 | |
| Elder Ray (13): | 0.58 | |
| Super Trend (3,10): | 38.03 | |
| Zig ZAG (10): | 39.94 | |
| VORTEX (21): | 0.9900 | |
| Stochastique (14,3,5): | 66.51 | |
| TEMA (21): | 39.41 | |
| Williams %R (14): | -27.00 | |
| Chande Momentum Oscillator (20): | -0.02 | |
| Repulse (5,40,3): | -0.3600 | |
| ROCnROLL: | 1 | |
| TRIX (15,9): | -0.0200 | |
| Courbe Coppock: | 3.01 |
| MA7: | 39.40 | |
| MA20: | 39.53 | |
| MA50: | 39.56 | |
| MA100: | 38.25 | |
| MAexp7: | 39.57 | |
| MAexp20: | 39.45 | |
| MAexp50: | 39.17 | |
| MAexp100: | 38.16 | |
| Price / MA7: | -0.81% | |
| Price / MA20: | -1.14% | |
| Price / MA50: | -1.21% | |
| Price / MA100: | +2.17% | |
| Price / MAexp7: | -1.24% | |
| Price / MAexp20: | -0.94% | |
| Price / MAexp50: | -0.23% | |
| Price / MAexp100: | +2.41% |
News
Don"t forget to follow the news on RECORDATI ORD. At the time of publication of this analysis, the latest news was as follows:
- Helsinn and Recordati Rare Diseases to announce satellite symposium on advances in Mycosis Fungoides-Cutaneous T cell Lymphoma
- RECORDATI TO MEET WITH THE FINANCIAL COMMUNITY
- RECORDATI: BOARD APPROVES THE 2018 ACCOUNTS. SALES € 1,352.2 MILLION (+5.0%), EBITDA € 499.1 MILLION (+9.8%), OPERATING INCOME € 442.2 MILLION (+8.8%) AND NET INCOME € 312.4 MILLION (+8.2%). 2018 DIVIDEND € 0.92 (+8.2%)
- RECORDATI: PRELIMINARY 2018 RESULTS CONFIRM CONTINUED GROWTH OF SALES AND PROFITABILITY. SALES +5.0%, EBITDA +9.8%, OPERATING INCOME +8.8%, NET INCOME +8.2%
- RECORDATI OBTAINS EXCLUSIVE LICENSE FOR JUXTAPID® IN JAPAN
About author

Online


Add a comment
Comments
0 comments on the analysis RECORDATI ORD - Daily