UNIPOL - Daily - Technical analysis published on 12/17/2019 (GMT)
- Who voted?
- 238
- 0
Click here for a new analysis!
- Timeframe : Daily
- - Analysis generated on
- Status : INVALID
Summary of the analysis

Additional analysis
Quotes
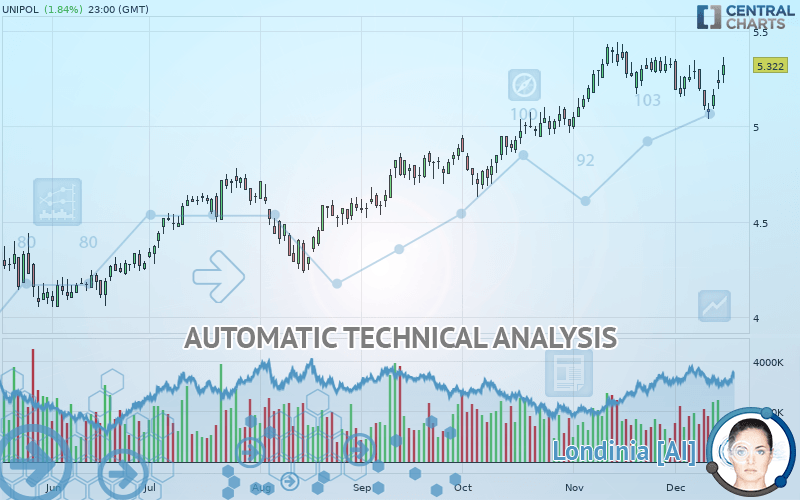
The UNIPOL price is 5.322 EUR. The price registered an increase of +1.84% on the session with the lowest point at 5.226 EUR and the highest point at 5.362 EUR. The deviation from the price is +1.84% for the low point and -0.75% for the high point.The Central Gaps scanner detects the formation of a bullish gap marking the strong presence of buyers against sellers at the opening. This formed a quotation gap.
Opening Gap UP
Type : Bullish
Timeframe : Openning
A study of price movements over other periods shows the following variations:
Near a new HIGH record (5 years)
Type : Bullish
Timeframe : Weekly
Near a new HIGH record (1 year)
Type : Bullish
Timeframe : Weekly
Near a new HIGH record (1st january)
Type : Bullish
Timeframe : Weekly
Technical
Technical analysis of this Daily chart of UNIPOL indicates that the overall trend is strongly bullish. 89.29% of the signals given by moving averages are bullish. The slightly bullish signals given by the short-term moving averages indicate this trend is showing signs of running out of steam. The Central Indicators scanner detects bullish signals on moving averages that could impact this trend:
Bullish trend reversal : adaptative moving average 50
Type : Bullish
Timeframe : Daily
Bullish price crossover with Moving Average 50
Type : Bullish
Timeframe : Daily
Bullish price crossover with adaptative moving average 50
Type : Bullish
Timeframe : Daily
In fact, of the 18 technical indicators analysed by Central Analyzer, 6 are bullish, 7 are neutral and 5 are bearish. Caution: the Central Indicators scanner currently detects an excess:
CCI indicator is oversold : under -100
Type : Neutral
Timeframe : Daily
Previous candle closed under Bollinger bands
Type : Neutral
Timeframe : Daily
Pivot points : price is over resistance 1
Type : Neutral
Timeframe : Daily
MACD indicator is back under 0
Type : Bearish
Timeframe : Daily
The Central Patterns scanner, which studies chart patterns, resistances and supports, has identified this signal:
Near horizontal support
Type : Bullish
Timeframe : Daily
Central Candlesticks, the scanner specialised in Japanese candlesticks, detects a bullish signal that could support the hypothesis of a small rebound in the very short term:
White morning star
Type : Bullish
Timeframe : Daily
| S3 | S2 | S1 | Price | R1 | R2 | R3 | |
|---|---|---|---|---|---|---|---|
| ProTrendLines | 4.513 | 4.727 | 5.284 | 5.322 | 5.416 | 23.620 | 42.100 |
| Change (%) | -15.20% | -11.18% | -0.71% | - | +1.77% | +343.82% | +691.06% |
| Change | -0.809 | -0.595 | -0.038 | - | +0.094 | +18.298 | +36.778 |
| Level | Major | Intermediate | Major | - | Major | Minor | Intermediate |
Attention could also be paid to pivot points to set price objectives:
| Pivot points | S3 | S2 | S1 | PP | R1 | R2 | R3 |
|---|---|---|---|---|---|---|---|
| Standard | 4.995 | 5.041 | 5.103 | 5.149 | 5.211 | 5.257 | 5.319 |
| Camarilla | 5.134 | 5.144 | 5.154 | 5.164 | 5.174 | 5.184 | 5.194 |
| Woodie | 5.002 | 5.045 | 5.110 | 5.153 | 5.218 | 5.261 | 5.326 |
| Fibonacci | 5.041 | 5.083 | 5.108 | 5.149 | 5.191 | 5.216 | 5.257 |
| Pivot points | S3 | S2 | S1 | PP | R1 | R2 | R3 |
|---|---|---|---|---|---|---|---|
| Standard | 4.977 | 5.065 | 5.175 | 5.263 | 5.373 | 5.461 | 5.571 |
| Camarilla | 5.230 | 5.248 | 5.266 | 5.284 | 5.302 | 5.320 | 5.338 |
| Woodie | 4.987 | 5.071 | 5.185 | 5.269 | 5.383 | 5.467 | 5.581 |
| Fibonacci | 5.065 | 5.141 | 5.188 | 5.263 | 5.339 | 5.386 | 5.461 |
| Pivot points | S3 | S2 | S1 | PP | R1 | R2 | R3 |
|---|---|---|---|---|---|---|---|
| Standard | 4.603 | 4.795 | 5.057 | 5.249 | 5.511 | 5.703 | 5.965 |
| Camarilla | 5.195 | 5.237 | 5.278 | 5.320 | 5.362 | 5.403 | 5.445 |
| Woodie | 4.639 | 4.813 | 5.093 | 5.267 | 5.547 | 5.721 | 6.001 |
| Fibonacci | 4.795 | 4.968 | 5.075 | 5.249 | 5.422 | 5.529 | 5.703 |
Numerical data
The following are the details of the technical indicators and moving averages that were collected to generate this technical analysis:
| RSI (14): | 51.89 | |
| MACD (12,26,9): | 0.0010 | |
| Directional Movement: | 1.737 | |
| AROON (14): | -64.285 | |
| DEMA (21): | 5.231 | |
| Parabolic SAR (0,02-0,02-0,2): | 5.315 | |
| Elder Ray (13): | 0.038 | |
| Super Trend (3,10): | 5.374 | |
| Zig ZAG (10): | 5.226 | |
| VORTEX (21): | 0.9140 | |
| Stochastique (14,3,5): | 35.94 | |
| TEMA (21): | 5.168 | |
| Williams %R (14): | -42.77 | |
| Chande Momentum Oscillator (20): | -0.064 | |
| Repulse (5,40,3): | -1.0740 | |
| ROCnROLL: | 1 | |
| TRIX (15,9): | 0.0700 | |
| Courbe Coppock: | 4.61 |
| MA7: | 5.187 | |
| MA20: | 5.246 | |
| MA50: | 5.134 | |
| MA100: | 4.880 | |
| MAexp7: | 5.187 | |
| MAexp20: | 5.213 | |
| MAexp50: | 5.121 | |
| MAexp100: | 4.935 | |
| Price / MA7: | +2.60% | |
| Price / MA20: | +1.45% | |
| Price / MA50: | +3.66% | |
| Price / MA100: | +9.06% | |
| Price / MAexp7: | +2.60% | |
| Price / MAexp20: | +2.09% | |
| Price / MAexp50: | +3.93% | |
| Price / MAexp100: | +7.84% |
News
The latest news and videos published on UNIPOL at the time of the analysis were as follows:
- Unipol Group Partners with TrueMotion for Italy's First Smartphone-Only Telematics Program
-
 Unipol
-
Unipol
About author

Online


Add a comment
Comments
0 comments on the analysis UNIPOL - Daily