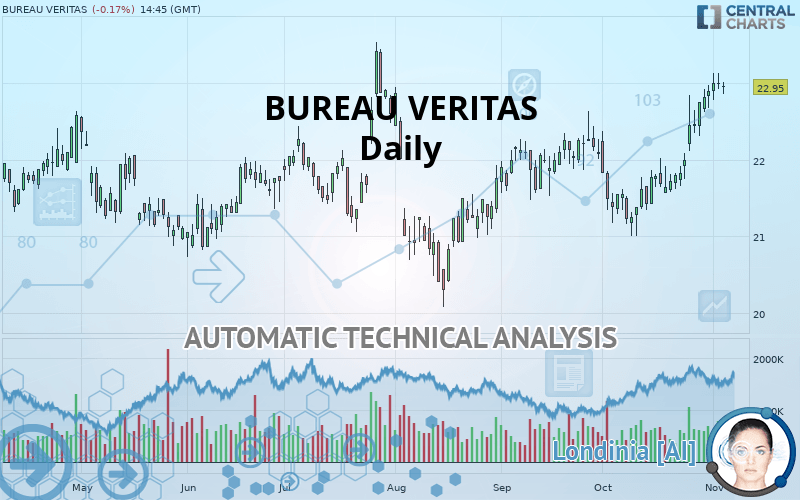
BUREAU VERITAS - Daily - Technical analysis published on 11/05/2019 (GMT)
- Who voted?
- 314
- 0
Click here for a new analysis!
- Timeframe : Daily
- - Analysis generated on
- Status : TARGET REACHED

Summary of the analysis

Additional analysis
Quotes
The BUREAU VERITAS rating is 22.95 EUR. The price is lower by -0.17% since the last closing and was traded between 22.85 EUR and 23.01 EUR over the period. The price is currently at +0.44% from its lowest and -0.26% from its highest.The Central Gaps scanner detects a bearish gap which is a sign that the sellers have taken the lead in the very short term.
Opening Gap DOWN
Type : Bearish
Timeframe : Openning
A study of price movements over other periods shows the following variations:
Near a new HIGH record (5 years)
Type : Bullish
Timeframe : Weekly
Near a new HIGH record (1st january)
Type : Bullish
Timeframe : Weekly
Near a new HIGH record (1 month)
Type : Bullish
Timeframe : Weekly
Technical
Technical analysis of this Daily chart of BUREAU VERITAS indicates that the overall trend is strongly bullish. 92.86% of the signals given by moving averages are bullish. This strongly bullish trend is supported by the strong bullish signals given by short-term moving averages. The Central Indicators scanner does not detect any result on moving averages that would impact this trend.
In fact, 13 technical indicators on 18 studied are currently positioned bullish. But beware of excesses. The Central Indicators scanner currently detects this:
RSI indicator is overbought : over 70
Type : Neutral
Timeframe : Daily
CCI indicator is overbought : over 100
Type : Neutral
Timeframe : Daily
Williams %R indicator is overbought : over -20
Type : Neutral
Timeframe : Daily
Pivot points : price is under support 1
Type : Neutral
Timeframe : Daily
Price is back over the pivot point
Type : Bullish
Timeframe : Daily
Price is back over the pivot point
Type : Bullish
Timeframe : Weekly
Central Patterns, the market scanner focusing on chart patterns, resistances and supports found this result:
Near resistance of channel
Type : Bearish
Timeframe : Daily
No result was found by the Central Candlesticks scanner on Japanese candlesticks.
| S3 | S2 | S1 | Price | R1 | R2 | R3 | |
|---|---|---|---|---|---|---|---|
| ProTrendLines | 21.24 | 21.78 | 22.26 | 22.95 | 23.42 | 24.18 | 25.01 |
| Change (%) | -7.45% | -5.10% | -3.01% | - | +2.05% | +5.36% | +8.98% |
| Change | -1.71 | -1.17 | -0.69 | - | +0.47 | +1.23 | +2.06 |
| Level | Major | Major | Intermediate | - | Major | Minor | Intermediate |
To determine price objectives, it is also possible to use the pivot points. Here is the price position in relation to pivot points:
| Pivot points | S3 | S2 | S1 | PP | R1 | R2 | R3 |
|---|---|---|---|---|---|---|---|
| Standard | 22.90 | 22.94 | 23.02 | 23.06 | 23.14 | 23.18 | 23.26 |
| Camarilla | 23.07 | 23.08 | 23.09 | 23.10 | 23.11 | 23.12 | 23.13 |
| Woodie | 22.92 | 22.95 | 23.04 | 23.07 | 23.16 | 23.19 | 23.28 |
| Fibonacci | 22.94 | 22.99 | 23.01 | 23.06 | 23.11 | 23.13 | 23.18 |
| Pivot points | S3 | S2 | S1 | PP | R1 | R2 | R3 |
|---|---|---|---|---|---|---|---|
| Standard | 21.65 | 21.98 | 22.48 | 22.81 | 23.31 | 23.64 | 24.14 |
| Camarilla | 22.76 | 22.84 | 22.91 | 22.99 | 23.07 | 23.14 | 23.22 |
| Woodie | 21.75 | 22.02 | 22.58 | 22.85 | 23.41 | 23.68 | 24.24 |
| Fibonacci | 21.98 | 22.29 | 22.49 | 22.81 | 23.12 | 23.32 | 23.64 |
| Pivot points | S3 | S2 | S1 | PP | R1 | R2 | R3 |
|---|---|---|---|---|---|---|---|
| Standard | 19.63 | 20.32 | 21.60 | 22.29 | 23.57 | 24.26 | 25.54 |
| Camarilla | 22.35 | 22.53 | 22.71 | 22.89 | 23.07 | 23.25 | 23.43 |
| Woodie | 19.94 | 20.47 | 21.91 | 22.44 | 23.88 | 24.41 | 25.85 |
| Fibonacci | 20.32 | 21.07 | 21.53 | 22.29 | 23.04 | 23.50 | 24.26 |
Numerical data
The following are the details of the technical indicators and moving averages that were collected to generate this technical analysis:
| RSI (14): | 69.62 | |
| MACD (12,26,9): | 0.3400 | |
| Directional Movement: | 18.86 | |
| AROON (14): | 71.42 | |
| DEMA (21): | 22.71 | |
| Parabolic SAR (0,02-0,02-0,2): | 22.01 | |
| Elder Ray (13): | 0.40 | |
| Super Trend (3,10): | 22.03 | |
| Zig ZAG (10): | 22.89 | |
| VORTEX (21): | 1.1800 | |
| Stochastique (14,3,5): | 91.93 | |
| TEMA (21): | 22.97 | |
| Williams %R (14): | -14.10 | |
| Chande Momentum Oscillator (20): | 1.27 | |
| Repulse (5,40,3): | 1.1100 | |
| ROCnROLL: | 1 | |
| TRIX (15,9): | 0.1300 | |
| Courbe Coppock: | 11.37 |
| MA7: | 22.85 | |
| MA20: | 22.11 | |
| MA50: | 21.97 | |
| MA100: | 21.80 | |
| MAexp7: | 22.79 | |
| MAexp20: | 22.34 | |
| MAexp50: | 22.01 | |
| MAexp100: | 21.74 | |
| Price / MA7: | +0.44% | |
| Price / MA20: | +3.80% | |
| Price / MA50: | +4.46% | |
| Price / MA100: | +5.28% | |
| Price / MAexp7: | +0.70% | |
| Price / MAexp20: | +2.73% | |
| Price / MAexp50: | +4.27% | |
| Price / MAexp100: | +5.57% |
News
Don"t forget to follow the news on BUREAU VERITAS. At the time of publication of this analysis, the latest news was as follows:
- BUREAU VERITAS: Number of shares and voting rights as of September 30, 2019
- BUREAU VERITAS: Number of shares and voting rights as of August 31, 2019
- Bureau Veritas Signs Partnership With Cornis to Offer Advanced Blade Inspection Services for Wind Turbines
- Bureau Veritas Becomes the First Accredited Canadian Laboratory For Environmental DNA (eDNA) Testing
- Dignity Gold, LLC Hires Bureau Veritas through SION Trading FZE to Independently Verify Gold, Which is Backing its Dignity Tokens
About author

Online


Add a comment
Comments
0 comments on the analysis BUREAU VERITAS - Daily