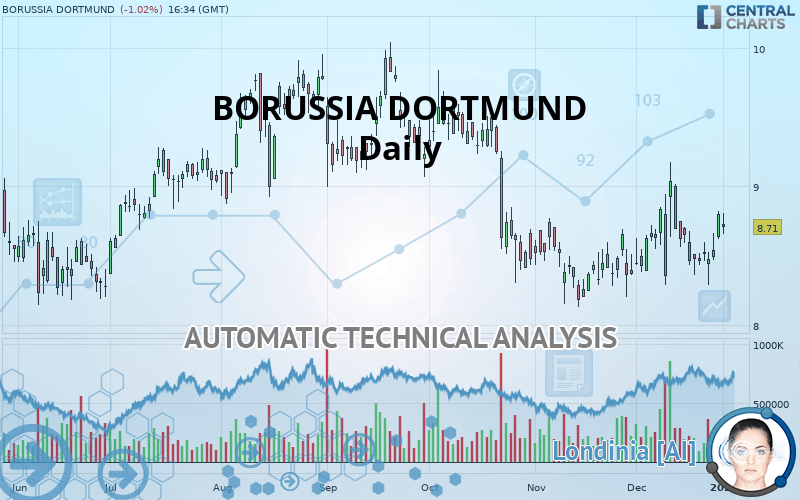
BORUSSIA DORTMUND - Daily - Technical analysis published on 01/02/2020 (GMT)
- Who voted?
- 241
- 0
Click here for a new analysis!
- Timeframe : Daily
- - Analysis generated on
- Status : TARGET REACHED

Summary of the analysis

Additional analysis
Quotes
BORUSSIA DORTMUND rating 8.710 EUR. On the day, this instrument lost -1.02% and was between 8.655 EUR and 8.805 EUR. This implies that the price is at +0.64% from its lowest and at -1.08% from its highest.The Central Gaps scanner detects a bearish opening. A small advantage for sellers in the very short term.
Bearish opening
Type : Bearish
Timeframe : Openning
So that you have an overall view of the price change, here is a table showing the variations over several periods:
Technical
Technical analysis of this Daily chart of BORUSSIA DORTMUND indicates that the overall trend is slightly bearish. Only 53.57% of the signals given by moving averages are bearish. This slightly bearish trend could quickly be reversed due to the strong bullish signals currently being given by short-term moving averages. The Central Indicators market scanner is currently detecting several bullish signals that could impact this trend:
Bullish trend reversal : adaptative moving average 20
Type : Bullish
Timeframe : Daily
Bullish trend reversal : adaptative moving average 50
Type : Bullish
Timeframe : Daily
Bullish price crossover with Moving Average 20
Type : Bullish
Timeframe : Daily
Bullish price crossover with Moving Average 50
Type : Bullish
Timeframe : Daily
Bullish price crossover with adaptative moving average 20
Type : Bullish
Timeframe : Daily
Bullish price crossover with adaptative moving average 50
Type : Bullish
Timeframe : Daily
On the 18 technical indicators analysed, 9 are bullish, 5 are neutral and 4 are bearish. But beware of excesses. The Central Indicators scanner currently detects this:
Williams %R indicator is overbought : over -20
Type : Neutral
Timeframe : Daily
Pivot points : price is over resistance 1
Type : Neutral
Timeframe : Weekly
RSI indicator is back over 50
Type : Bullish
Timeframe : Daily
MACD crosses UP its Moving Average
Type : Bullish
Timeframe : Daily
Price is back over the pivot point
Type : Bullish
Timeframe : Daily
Williams %R indicator is back over -50
Type : Bullish
Timeframe : Daily
Central Patterns, the market scanner focusing on chart patterns, resistances and supports found this result:
Near support of channel
Type : Bullish
Timeframe : Daily
No result was found by the Central Candlesticks scanner on Japanese candlesticks.
| S3 | S2 | S1 | Price | R1 | R2 | R3 | |
|---|---|---|---|---|---|---|---|
| ProTrendLines | 7.005 | 8.277 | 8.646 | 8.710 | 8.845 | 9.036 | 9.455 |
| Change (%) | -19.58% | -4.97% | -0.73% | - | +1.55% | +3.74% | +8.55% |
| Change | -1.705 | -0.433 | -0.064 | - | +0.135 | +0.326 | +0.745 |
| Level | Minor | Major | Intermediate | - | Intermediate | Major | Major |
To determine price objectives, it is also possible to use the pivot points. Here is the price position in relation to pivot points:
| Pivot points | S3 | S2 | S1 | PP | R1 | R2 | R3 |
|---|---|---|---|---|---|---|---|
| Standard | 8.473 | 8.547 | 8.673 | 8.747 | 8.873 | 8.947 | 9.073 |
| Camarilla | 8.745 | 8.763 | 8.782 | 8.800 | 8.818 | 8.837 | 8.855 |
| Woodie | 8.500 | 8.560 | 8.700 | 8.760 | 8.900 | 8.960 | 9.100 |
| Fibonacci | 8.547 | 8.623 | 8.670 | 8.747 | 8.823 | 8.870 | 8.947 |
| Pivot points | S3 | S2 | S1 | PP | R1 | R2 | R3 |
|---|---|---|---|---|---|---|---|
| Standard | 7.915 | 8.100 | 8.295 | 8.480 | 8.675 | 8.860 | 9.055 |
| Camarilla | 8.386 | 8.420 | 8.455 | 8.490 | 8.525 | 8.560 | 8.595 |
| Woodie | 7.920 | 8.103 | 8.300 | 8.483 | 8.680 | 8.863 | 9.060 |
| Fibonacci | 8.100 | 8.245 | 8.335 | 8.480 | 8.625 | 8.715 | 8.860 |
| Pivot points | S3 | S2 | S1 | PP | R1 | R2 | R3 |
|---|---|---|---|---|---|---|---|
| Standard | 7.442 | 7.863 | 8.332 | 8.753 | 9.222 | 9.643 | 10.112 |
| Camarilla | 8.555 | 8.637 | 8.718 | 8.800 | 8.882 | 8.963 | 9.045 |
| Woodie | 7.465 | 7.875 | 8.355 | 8.765 | 9.245 | 9.655 | 10.135 |
| Fibonacci | 7.863 | 8.203 | 8.413 | 8.753 | 9.093 | 9.303 | 9.643 |
Numerical data
The following is the status of the technical indicators and moving averages at the time of publication of this technical analysis:
| RSI (14): | 53.71 | |
| MACD (12,26,9): | 0.0100 | |
| Directional Movement: | -0.349 | |
| AROON (14): | -57.142 | |
| DEMA (21): | 8.586 | |
| Parabolic SAR (0,02-0,02-0,2): | 8.935 | |
| Elder Ray (13): | 0.133 | |
| Super Trend (3,10): | 8.027 | |
| Zig ZAG (10): | 8.725 | |
| VORTEX (21): | 0.9220 | |
| Stochastique (14,3,5): | 43.45 | |
| TEMA (21): | 8.659 | |
| Williams %R (14): | -50.56 | |
| Chande Momentum Oscillator (20): | 0.375 | |
| Repulse (5,40,3): | 1.0070 | |
| ROCnROLL: | 1 | |
| TRIX (15,9): | -0.0010 | |
| Courbe Coppock: | 0.08 |
| MA7: | 8.566 | |
| MA20: | 8.589 | |
| MA50: | 8.571 | |
| MA100: | 9.023 | |
| MAexp7: | 8.620 | |
| MAexp20: | 8.587 | |
| MAexp50: | 8.671 | |
| MAexp100: | 8.789 | |
| Price / MA7: | +1.68% | |
| Price / MA20: | +1.41% | |
| Price / MA50: | +1.62% | |
| Price / MA100: | -3.47% | |
| Price / MAexp7: | +1.04% | |
| Price / MAexp20: | +1.43% | |
| Price / MAexp50: | +0.45% | |
| Price / MAexp100: | -0.90% |
News
The latest news and videos published on BORUSSIA DORTMUND at the time of the analysis were as follows:
- DGAP-News: Borussia Dortmund and PUMA extend their partnership until 2028
- Borussia Dortmund and PUMA Extend Their Partnership Until 2028
- DGAP-News: BVB share: Frankfurt Main Research confirms 'buy' recommendation
- DGAP-Adhoc: Borussia Dortmund announces preliminary results for the first quarter (Q1) of the fiscal year 2019/2020
- DGAP-News: Borussia Dortmund intends to pay a dividend in an amount of 0.06 EUR per share
About author

Online


Add a comment
Comments
0 comments on the analysis BORUSSIA DORTMUND - Daily