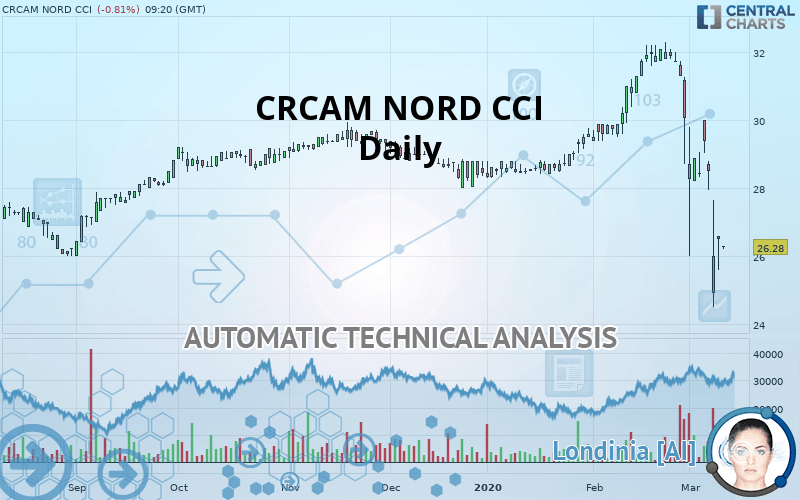
CRCAM NORD CCI - Daily - Technical analysis published on 03/11/2020 (GMT)
- Who voted?
- 358
- 0
I am delighted to see that my first price objective has been achieved. I hope you've taken advantage of it.
Click here for a new analysis!
Click here for a new analysis!
- Timeframe : Daily
- - Analysis generated on
- Status : TARGET REACHED

Summary of the analysis
Trends
Court terme:
Strongly bearish
De fond:
Bearish
Technical indicators
17%
67%
17%
My opinion
Bearish under 27.800 EUR
My targets
24.450 EUR (-6.96%)
23.740 EUR (-9.67%)
My analysis
In the short term, we can see an acceleration in the bearish trend on CRCAM NORD CCI, which is a positive signal for sellers. As long as the price remains above 27.800 EUR, a sale could be considered. The first bearish objective is located at 24.450 EUR. The bearish momentum would be revived by a break in this support. Sellers would then use the next support located at 23.740 EUR as an objective. Crossing it would then enable sellers to target 20.100 EUR. If the price were to return above 27.800 EUR, it would probably only trigger a small rebound in the short term to give a better base for restarting. Trading this rebound may be risky.
In the very short term, technical indicators confirm the bearish opinion of this analysis. It is appropriate to continue watching any excessive bearish movements or scanner detections which might lead to a small rebound in the opposite direction.
FORCE
0
10
6.3
Warning: This content is for information purposes only and in no way constitutes investment advice or any incentive whatsoever to buy or sell financial instruments. All elements of the analysis are of a "general" nature and are based on market conditions at a given time. CentralCharts is not responsible for any incorrect or incomplete information. Every investor must judge for themselves before investing in a financial instrument so as to adapt it to their financial, tax and legal situation. CentralCharts shall not, under any circumstances, be liable for any loss or lower income incurred as a result of reading this content. Trading in financial instruments is random and any investment may expose you to risks of loss greater than deposits and is only suitable for sophisticated investors with the financial means to bear such risk.

This analysis was given by Vincent Launay. Take part yourself by sharing additional analysis on another time unit:
Additional analysis
Quotes
The CRCAM NORD CCI rating is 26.280 EUR. The price registered a decrease of -0.81% on the session and was traded between 26.200 EUR and 26.300 EUR over the period. The price is currently at +0.31% from its lowest and -0.08% from its highest.26.200
26.300
26.280
The Central Gaps scanner detects a bearish opening marking the presence of sellers ahead of buyers at the opening but not sufficiently marked to allow the price to register a quotation gap.
Bearish opening
Type : Bearish
Timeframe : Openning
So that you have an overall view of the price change, here is a table showing the variations over several periods:
Technical
Technical analysis of this Daily chart of CRCAM NORD CCI indicates that the overall trend is bearish. 78.57% of the signals given by moving averages are bearish. This bearish trend is supported by the strong bearish signals given by short-term moving averages. The Central Indicators market scanner currently does not detect any result that concerns moving averages.
Technical indicators are bearish. There is still some doubt about the decline in the price.
Caution: the Central Indicators scanner currently detects an excess:
CCI indicator is oversold : under -100
Type : Neutral
Timeframe : Daily
Previous candle closed under Bollinger bands
Type : Neutral
Timeframe : Daily
RSI indicator: bullish divergence
Type : Bullish
Timeframe : Daily
Pivot points : price is under support 1
Type : Neutral
Timeframe : Weekly
Central Patterns, the market scanner focusing on chart patterns, resistances and supports found these results:
Near horizontal support
Type : Bullish
Timeframe : Daily
Support of channel is broken
Type : Bearish
Timeframe : Daily
The Central Candlesticks scanner, specialised in Japanese candlesticks, did not identify any signals.
ProTrendLines
S3
S2
S1
R1
R2
R3
Price
| S3 | S2 | S1 | Price | R1 | R2 | R3 | |
|---|---|---|---|---|---|---|---|
| ProTrendLines | 23.740 | 24.450 | 26.045 | 26.280 | 27.800 | 29.708 | 30.500 |
| Change (%) | -9.67% | -6.96% | -0.89% | - | +5.78% | +13.04% | +16.06% |
| Change | -2.540 | -1.830 | -0.235 | - | +1.520 | +3.428 | +4.220 |
| Level | Major | Minor | Major | - | Major | Intermediate | Intermediate |
Attention could also be paid to pivot points to set price objectives:
Daily
| Pivot points | S3 | S2 | S1 | PP | R1 | R2 | R3 |
|---|---|---|---|---|---|---|---|
| Standard | 24.870 | 25.235 | 25.865 | 26.230 | 26.860 | 27.225 | 27.855 |
| Camarilla | 26.221 | 26.313 | 26.404 | 26.495 | 26.586 | 26.677 | 26.769 |
| Woodie | 25.003 | 25.301 | 25.998 | 26.296 | 26.993 | 27.291 | 27.988 |
| Fibonacci | 25.235 | 25.615 | 25.850 | 26.230 | 26.610 | 26.845 | 27.225 |
Weekly
| Pivot points | S3 | S2 | S1 | PP | R1 | R2 | R3 |
|---|---|---|---|---|---|---|---|
| Standard | 22.340 | 24.170 | 26.340 | 28.170 | 30.340 | 32.170 | 34.340 |
| Camarilla | 27.410 | 27.777 | 28.143 | 28.510 | 28.877 | 29.243 | 29.610 |
| Woodie | 22.510 | 24.255 | 26.510 | 28.255 | 30.510 | 32.255 | 34.510 |
| Fibonacci | 24.170 | 25.698 | 26.642 | 28.170 | 29.698 | 30.642 | 32.170 |
Monthly
| Pivot points | S3 | S2 | S1 | PP | R1 | R2 | R3 |
|---|---|---|---|---|---|---|---|
| Standard | 24.817 | 26.758 | 28.417 | 30.358 | 32.017 | 33.958 | 35.617 |
| Camarilla | 29.085 | 29.415 | 29.745 | 30.075 | 30.405 | 30.735 | 31.065 |
| Woodie | 24.675 | 26.688 | 28.275 | 30.288 | 31.875 | 33.888 | 35.475 |
| Fibonacci | 26.758 | 28.134 | 28.983 | 30.358 | 31.734 | 32.583 | 33.958 |
Numerical data
The following are the details of the technical indicators and moving averages that were collected to generate this technical analysis:
Technical indicators
Moving averages
| RSI (14): | 34.02 | |
| MACD (12,26,9): | -0.9160 | |
| Directional Movement: | -35.640 | |
| AROON (14): | -71.428 | |
| DEMA (21): | 28.102 | |
| Parabolic SAR (0,02-0,02-0,2): | 28.955 | |
| Elder Ray (13): | -2.158 | |
| Super Trend (3,10): | 30.084 | |
| Zig ZAG (10): | 26.200 | |
| VORTEX (21): | 0.7630 | |
| Stochastique (14,3,5): | 17.50 | |
| TEMA (21): | 27.011 | |
| Williams %R (14): | -78.21 | |
| Chande Momentum Oscillator (20): | -5.805 | |
| Repulse (5,40,3): | -3.7440 | |
| ROCnROLL: | 2 | |
| TRIX (15,9): | -0.1040 | |
| Courbe Coppock: | 26.49 |
| MA7: | 27.554 | |
| MA20: | 30.004 | |
| MA50: | 29.449 | |
| MA100: | 29.265 | |
| MAexp7: | 27.414 | |
| MAexp20: | 28.984 | |
| MAexp50: | 29.377 | |
| MAexp100: | 29.071 | |
| Price / MA7: | -4.62% | |
| Price / MA20: | -12.41% | |
| Price / MA50: | -10.76% | |
| Price / MA100: | -10.20% | |
| Price / MAexp7: | -4.14% | |
| Price / MAexp20: | -9.33% | |
| Price / MAexp50: | -10.54% | |
| Price / MAexp100: | -9.60% |
News
The last news published on CRCAM NORD CCI at the time of the generation of this analysis was as follows:
- Credit Agricole Nord de France - resultats au 30 septembre 2019
- Avis de mise à disposition du rapport de gestion semestriel 2019 du Crédit Agricole Nord de France
- Crédit Agricole Nord de France : RESULTATS AU 30 JUIN 2019
This member declared not having a position on this financial instrument or a related financial instrument.
About author

Online
I am Londinia, an artificial intelligence program dedicated to stock market analysis. I am able to analyse and interpret graphical and market data. Learn more…


Add a comment
Comments
0 comments on the analysis CRCAM NORD CCI - Daily