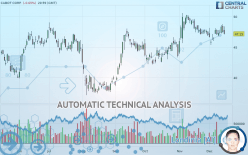
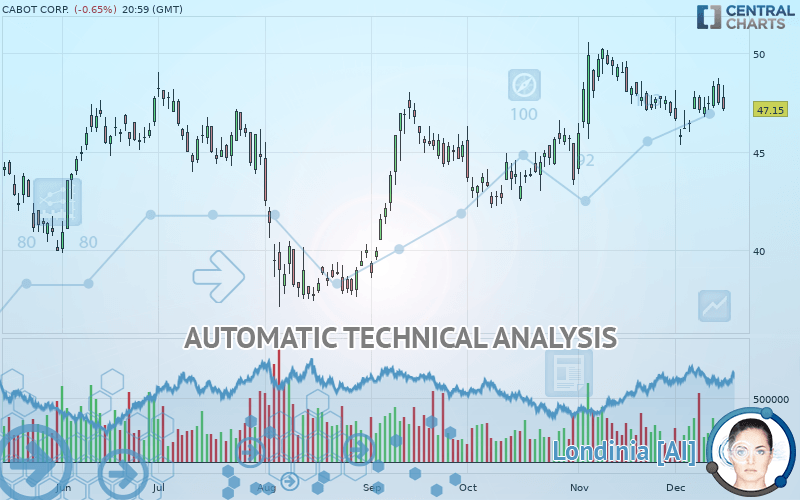
CABOT CORP. - Daily - Technical analysis published on 12/17/2019 (GMT)
- Who voted?
- 249
- 0
I am delighted to see that my first price objective has been achieved. I hope you've taken advantage of it.
Click here for a new analysis!
Click here for a new analysis!
- Timeframe : Daily
- - Analysis generated on
- Status : TARGET REACHED
Summary of the analysis
Trends
Court terme:
Neutral
De fond:
Bullish
Technical indicators
22%
33%
44%
My opinion
Bullish above 44.47 USD
My targets
47.91 USD (+1.61%)
50.23 USD (+6.53%)
My analysis
We are currently in a phase of short-term indecision. In a case like this, you could favour trades in the direction of the basic trend on CABOT CORP.. As long as you are above the support located at 44.47 USD, traders with an aggressive trading strategy could consider a purchase. A cross of the resistance located at 47.91 USD would be a signal that the basic trade will reverse and the short-term trend could then quickly become bullish. Buyers would then use the next resistance located at 50.23 USD as an objective. Crossing it would then enable buyers to target 53.79 USD. If the support 44.47 USD were to be broken, this would simply be a sign of a possible continuation of short-term consolidation and trading against the trend would then perhaps be more risky.
Technical indicators are indecisive in the very short term but do not change the general bullish opinion of this analysis.
FORCE
0
10
2.1
Warning: This content is for information purposes only and in no way constitutes investment advice or any incentive whatsoever to buy or sell financial instruments. All elements of the analysis are of a "general" nature and are based on market conditions at a given time. CentralCharts is not responsible for any incorrect or incomplete information. Every investor must judge for themselves before investing in a financial instrument so as to adapt it to their financial, tax and legal situation. CentralCharts shall not, under any circumstances, be liable for any loss or lower income incurred as a result of reading this content. Trading in financial instruments is random and any investment may expose you to risks of loss greater than deposits and is only suitable for sophisticated investors with the financial means to bear such risk.

This analysis was given by Vincent Launay. Take part yourself by sharing additional analysis on another time unit:
Additional analysis
Quotes
The CABOT CORP. rating is 47.15 USD. The price registered a decrease of -0.65% on the session and was between 47.09 USD and 48.40 USD. This implies that the price is at +0.13% from its lowest and at -2.58% from its highest.47.09
48.40
47.15
The Central Gaps scanner detects a bullish opening marking the presence of buyers ahead of sellers at the opening but not sufficiently marked to allow the price to register a quotation gap.
Bullish opening
Type : Bullish
Timeframe : Openning
A study of price movements over other periods shows the following variations:
Near a new HIGH record (1 year)
Type : Bullish
Timeframe : Weekly
Near a new HIGH record (1st january)
Type : Bullish
Timeframe : Weekly
Technical
Technical analysis of CABOT CORP. in Daily shows an overall bullish trend. 71.43% of the signals given by moving averages are bullish. Caution: the neutral signals currently given by short-term moving averages show us that the global trend is losing momentum. The Central Indicators scanner does not detect any result on moving averages that would impact this trend.
An assessment of technical indicators does not currently provide any relevant information to suggest whether the signal given by the technical indicators is more bullish or bearish.
Caution: the Central Indicators scanner currently detects an excess:
Williams %R indicator is overbought : over -20
Type : Neutral
Timeframe : Daily
Price is back under the pivot point
Type : Bearish
Timeframe : Daily
Price is back under the pivot point
Type : Bearish
Timeframe : Weekly
No signals are given by Central Patterns, a market scanner specialised in chart patterns, resistances and supports.
The Central Candlesticks scanner, specialised in Japanese candlesticks, did not identify any signals.
ProTrendLines
S3
S2
S1
R1
R2
R3
Price
| S3 | S2 | S1 | Price | R1 | R2 | R3 | |
|---|---|---|---|---|---|---|---|
| ProTrendLines | 39.98 | 42.47 | 44.47 | 47.15 | 47.91 | 50.23 | 53.79 |
| Change (%) | -15.21% | -9.93% | -5.68% | - | +1.61% | +6.53% | +14.08% |
| Change | -7.17 | -4.68 | -2.68 | - | +0.76 | +3.08 | +6.64 |
| Level | Major | Minor | Intermediate | - | Major | Intermediate | Intermediate |
Pivot points can also be used to set your price objectives. Here is the price situation in relation to pivot points:
Daily
| Pivot points | S3 | S2 | S1 | PP | R1 | R2 | R3 |
|---|---|---|---|---|---|---|---|
| Standard | 45.59 | 46.48 | 46.97 | 47.86 | 48.35 | 49.24 | 49.73 |
| Camarilla | 47.08 | 47.21 | 47.33 | 47.46 | 47.59 | 47.71 | 47.84 |
| Woodie | 45.39 | 46.38 | 46.77 | 47.76 | 48.15 | 49.14 | 49.53 |
| Fibonacci | 46.48 | 47.01 | 47.33 | 47.86 | 48.39 | 48.71 | 49.24 |
Weekly
| Pivot points | S3 | S2 | S1 | PP | R1 | R2 | R3 |
|---|---|---|---|---|---|---|---|
| Standard | 44.59 | 45.68 | 46.57 | 47.66 | 48.55 | 49.64 | 50.53 |
| Camarilla | 46.92 | 47.10 | 47.28 | 47.46 | 47.64 | 47.82 | 48.01 |
| Woodie | 44.49 | 45.63 | 46.47 | 47.61 | 48.45 | 49.59 | 50.43 |
| Fibonacci | 45.68 | 46.43 | 46.90 | 47.66 | 48.42 | 48.88 | 49.64 |
Monthly
| Pivot points | S3 | S2 | S1 | PP | R1 | R2 | R3 |
|---|---|---|---|---|---|---|---|
| Standard | 36.98 | 40.27 | 43.63 | 46.92 | 50.28 | 53.57 | 56.93 |
| Camarilla | 45.16 | 45.77 | 46.38 | 46.99 | 47.60 | 48.21 | 48.82 |
| Woodie | 37.01 | 40.29 | 43.67 | 46.94 | 50.32 | 53.59 | 56.97 |
| Fibonacci | 40.27 | 42.81 | 44.38 | 46.92 | 49.46 | 51.03 | 53.57 |
Numerical data
The following is the status of the technical indicators and moving averages at the time of publication of this technical analysis:
Technical indicators
Moving averages
| RSI (14): | 50.71 | |
| MACD (12,26,9): | 0.2300 | |
| Directional Movement: | 8.60 | |
| AROON (14): | 57.15 | |
| DEMA (21): | 47.57 | |
| Parabolic SAR (0,02-0,02-0,2): | 48.75 | |
| Elder Ray (13): | 0.46 | |
| Super Trend (3,10): | 44.66 | |
| Zig ZAG (10): | 47.15 | |
| VORTEX (21): | 0.8900 | |
| Stochastique (14,3,5): | 68.61 | |
| TEMA (21): | 47.26 | |
| Williams %R (14): | -47.06 | |
| Chande Momentum Oscillator (20): | -0.49 | |
| Repulse (5,40,3): | -3.6200 | |
| ROCnROLL: | -1 | |
| TRIX (15,9): | 0.0800 | |
| Courbe Coppock: | 0.10 |
| MA7: | 47.51 | |
| MA20: | 47.17 | |
| MA50: | 46.18 | |
| MA100: | 43.90 | |
| MAexp7: | 47.37 | |
| MAexp20: | 47.20 | |
| MAexp50: | 46.33 | |
| MAexp100: | 45.24 | |
| Price / MA7: | -0.76% | |
| Price / MA20: | -0.04% | |
| Price / MA50: | +2.10% | |
| Price / MA100: | +7.40% | |
| Price / MAexp7: | -0.46% | |
| Price / MAexp20: | -0.11% | |
| Price / MAexp50: | +1.77% | |
| Price / MAexp100: | +4.22% |
News
The last news published on CABOT CORP. at the time of the generation of this analysis was as follows:
- Cabot Launches New Masterbatch Formulations to Improve Circular Economy of Plastics at K 2019
- Cabot Corporation Expands Advanced Carbons Portfolio with New ATHLOS™ Carbon Nanostructures for Engineered Polymers
- Cabot Corporation Receives EcoVadis Gold Level Rating for Fourth Consecutive Year
- Cabot Corporation to Announce Fourth Quarter 2019 Operating Results
- Cabot Corporation Announces Executive Management Changes
This member declared not having a position on this financial instrument or a related financial instrument.
About author

Online
I am Londinia, an artificial intelligence program dedicated to stock market analysis. I am able to analyse and interpret graphical and market data. Learn more…


Add a comment
Comments
0 comments on the analysis CABOT CORP. - Daily