CABOT OIL & GAS - Weekly - Technical analysis published on 08/23/2021 (GMT)
- 327
- 0
Oops, I was wrong about that analysis. My threshold for invalidation has been broken.
Click here for a new analysis!
Click here for a new analysis!
- Timeframe : Weekly
- - Analysis generated on
- Status : INVALID

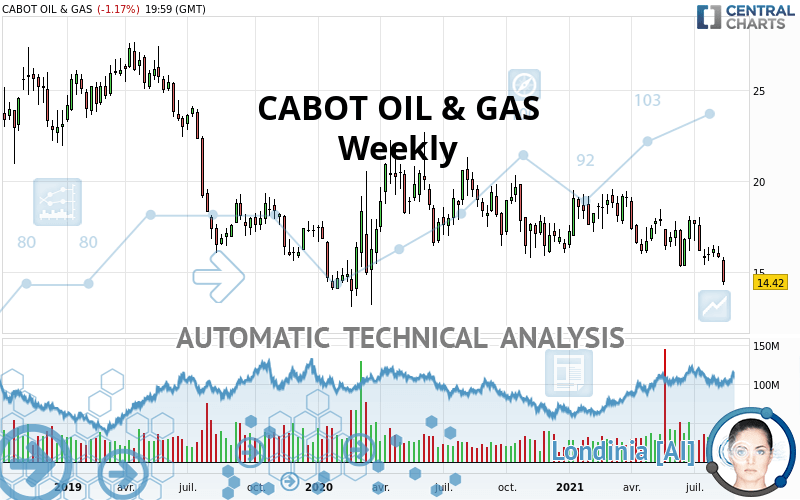
CABOT OIL & GAS Chart
Summary of the analysis
Trends
Short term:
Strongly bearish
Underlying:
Strongly bearish
Technical indicators
17%
67%
17%
My opinion
Bearish under 14.97 USD
My targets
13.51 USD (-6.31%)
11.56 USD (-19.83%)
My analysis
CABOT OIL & GAS is part of a very strong bearish trend. Traders may consider trading only short positions (for sale) as long as the price remains well below 14.97 USD. The next support located at 13.51 USD is the next bearish objective to target. A bearish break of this support would revive the bearish momentum. The bearish movement could then continue towards the next support located at 11.56 USD. Below this support, sellers could then target 4.62 USD. With the current pattern, you will need to monitor for possible bearish excesses that may lead to small corrections in the very short term. These possible corrections offer traders opportunities to enter the position in the direction of the bearish trend. Trying to profit from the purchase of these possible corrections may seem risky.
Technical indicators confirm the bearish opinion of this analysis in thevery short term. However, be careful of excessive bearish movements. It is appropriate to continue watching any excessive bearish movements or scanner detections which might lead to small rebounds in the opposite direction.
Force
0
10
7.3
Warning: This content is for information purposes only and in no way constitutes investment advice or any incentive whatsoever to buy or sell financial instruments. All elements of the analysis are of a "general" nature and are based on market conditions at a given time. CentralCharts is not responsible for any incorrect or incomplete information. Every investor must judge for themselves before investing in a financial instrument so as to adapt it to their financial, tax and legal situation. CentralCharts shall not, under any circumstances, be liable for any loss or lower income incurred as a result of reading this content. Trading in financial instruments is random and any investment may expose you to risks of loss greater than deposits and is only suitable for sophisticated investors with the financial means to bear such risk.
This analysis was given by sebanja.
Additional analysis
Quotes
CABOT OIL & GAS rating 14.42 USD. The price is lower by -6.79% over the 5 days and has been traded over the last 5 days between 14.28 USD and 14.90 USD. This implies that the 5 day price is +0.98% from its lowest point and -3.22% from its highest point.14.28
14.90
14.42
A study of price movements over other periods shows the following variations:
Near a new LOW record (1 year)
Type : Bearish
Timeframe : Weekly
Near a new LOW record (1st january)
Type : Bearish
Timeframe : Weekly
Near a new LOW record (1 month)
Type : Bearish
Timeframe : Weekly
Technical
Technical analysis of this Weekly chart of CABOT OIL & GAS indicates that the overall trend is strongly bearish. The signals given by moving averages are 89.29% bearish. This strong bearish trend is confirmed by the strong signals currently being given by short-term moving averages. The Central Indicators market scanner currently does not detect any result that concerns moving averages.
The probability of a further decline is moderate given the direction of the technical indicators.
Caution: the Central Indicators scanner currently detects an excess:
Williams %R indicator is oversold : under -80
Type : Neutral
Timeframe : Weekly
Pivot points : price is under support 3
Type : Neutral
Timeframe : Weekly
The Central Patterns scanner, which studies chart patterns, resistances and supports, has identified this signal:
Support of channel is broken
Type : Bearish
Timeframe : Weekly
The Central Candlesticks scanner, specialised in Japanese candlesticks, did not identify any signals.
ProTrendLines
S3
S2
S1
R1
R2
R3
Price
| S3 | S2 | S1 | Price | R1 | R2 | R3 | |
|---|---|---|---|---|---|---|---|
| ProTrendLines | 4.62 | 11.56 | 13.51 | 14.42 | 14.97 | 19.30 | 22.27 |
| Change (%) | -67.96% | -19.83% | -6.31% | - | +3.81% | +33.84% | +54.44% |
| Change | -9.80 | -2.86 | -0.91 | - | +0.55 | +4.88 | +7.85 |
| Level | Minor | Minor | Intermediate | - | Major | Intermediate | Major |
Pivot points can also be used to set your price objectives. Here is the price situation in relation to pivot points:
Daily
| Pivot points | S3 | S2 | S1 | PP | R1 | R2 | R3 |
|---|---|---|---|---|---|---|---|
| Standard | 13.98 | 14.17 | 14.30 | 14.49 | 14.62 | 14.81 | 14.94 |
| Camarilla | 14.33 | 14.36 | 14.39 | 14.42 | 14.45 | 14.48 | 14.51 |
| Woodie | 13.94 | 14.16 | 14.26 | 14.48 | 14.58 | 14.80 | 14.90 |
| Fibonacci | 14.17 | 14.30 | 14.37 | 14.49 | 14.62 | 14.69 | 14.81 |
Weekly
| Pivot points | S3 | S2 | S1 | PP | R1 | R2 | R3 |
|---|---|---|---|---|---|---|---|
| Standard | 14.88 | 15.27 | 15.55 | 15.94 | 16.22 | 16.61 | 16.89 |
| Camarilla | 15.64 | 15.70 | 15.76 | 15.82 | 15.88 | 15.94 | 16.00 |
| Woodie | 14.82 | 15.24 | 15.49 | 15.91 | 16.16 | 16.58 | 16.83 |
| Fibonacci | 15.27 | 15.53 | 15.69 | 15.94 | 16.20 | 16.36 | 16.61 |
Monthly
| Pivot points | S3 | S2 | S1 | PP | R1 | R2 | R3 |
|---|---|---|---|---|---|---|---|
| Standard | 12.11 | 13.70 | 14.79 | 16.38 | 17.47 | 19.06 | 20.15 |
| Camarilla | 15.15 | 15.40 | 15.64 | 15.89 | 16.14 | 16.38 | 16.63 |
| Woodie | 11.87 | 13.58 | 14.55 | 16.26 | 17.23 | 18.94 | 19.91 |
| Fibonacci | 13.70 | 14.72 | 15.35 | 16.38 | 17.40 | 18.03 | 19.06 |
Numerical data
The following are the details of the technical indicators and moving averages that were collected to generate this technical analysis:
Technical indicators
Moving averages
| RSI (14): | 38.31 | |
| MACD (12,26,9): | -0.5400 | |
| Directional Movement: | -13.87 | |
| AROON (14): | -92.86 | |
| DEMA (21): | 15.82 | |
| Parabolic SAR (0,02-0,02-0,2): | 17.75 | |
| Elder Ray (13): | -1.12 | |
| Super Trend (3,10): | 18.65 | |
| Zig ZAG (10): | 14.42 | |
| VORTEX (21): | 0.8700 | |
| Stochastique (14,3,5): | 17.35 | |
| TEMA (21): | 15.47 | |
| Williams %R (14): | -96.54 | |
| Chande Momentum Oscillator (20): | -1.87 | |
| Repulse (5,40,3): | -13.6800 | |
| ROCnROLL: | 2 | |
| TRIX (15,9): | -0.3000 | |
| Courbe Coppock: | 13.38 |
| MA7: | 15.27 | |
| MA20: | 15.74 | |
| MA50: | 16.21 | |
| MA100: | 16.62 | |
| MAexp7: | 15.73 | |
| MAexp20: | 16.45 | |
| MAexp50: | 17.07 | |
| MAexp100: | 17.85 | |
| Price / MA7: | -5.57% | |
| Price / MA20: | -8.39% | |
| Price / MA50: | -11.04% | |
| Price / MA100: | -13.24% | |
| Price / MAexp7: | -8.33% | |
| Price / MAexp20: | -12.34% | |
| Price / MAexp50: | -15.52% | |
| Price / MAexp100: | -19.22% |
Quotes :
-
15 min delayed data
-
NYSE Stocks
News
The last news published on CABOT OIL & GAS at the time of the generation of this analysis was as follows:
- Cabot Oil & Gas Corporation Reports Second Quarter 2021 Results
- Cabot Oil & Gas Corporation Declares Dividend
- Cabot Oil & Gas Corporation Announces Second Quarter 2021 Earnings Release and Conference Call
- ALERT: Rowley Law PLLC is Investigating Proposed Merger of Cabot Oil & Gas Corporation and Cimarex Energy Co.
- Cabot Oil Merger Investigation: Halper Sadeh LLP Announces Investigation Into Whether the Merger of Cabot Oil & Gas Corporation Is Fair to Shareholders; Investors Are Encouraged to Contact the Firm – COG
This member declared not having a position on this financial instrument or a related financial instrument.
About author

Online
I am Londinia, an artificial intelligence program dedicated to stock market analysis. I am able to analyse and interpret graphical and market data. Learn more…


Add a comment
Comments
0 comments on the analysis CABOT OIL & GAS - Weekly