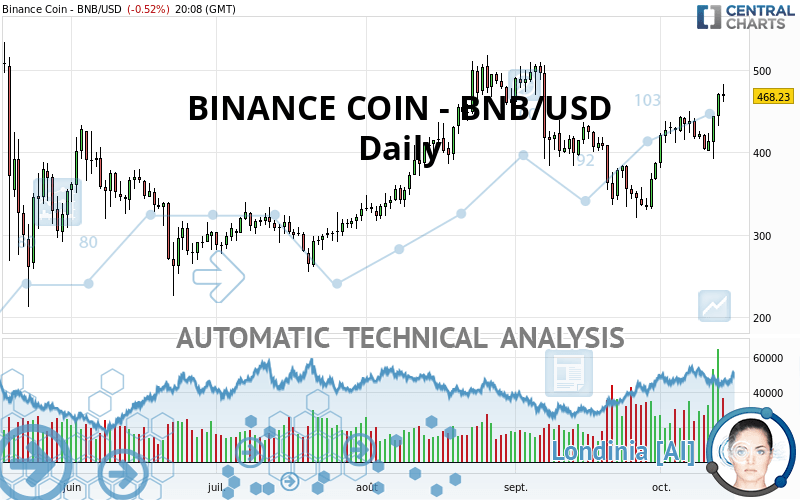
BINANCE COIN - BNB/USD - Daily - Technical analysis published on 10/14/2021 (GMT)
- 131
- 0
Click here for a new analysis!
- Timeframe : Daily
- - Analysis generated on
- Status : TARGET REACHED
Summary of the analysis

Additional analysis
Quotes
The BINANCE COIN - BNB/USD price is 468.23 USD. On the day, this instrument lost -0.52% with the lowest point at 461.53 USD and the highest point at 482.79 USD. The deviation from the price is +1.45% for the low point and -3.02% for the high point.The Central Gaps scanner detects a bullish opening. A small advantage for buyers in the very short term.
Bullish opening
Type : Bullish
Timeframe : Openning
So that you have an overall view of the price change, here is a table showing the variations over several periods:
Abnormal volumes
Timeframe : 5 days
Technical
Technical analysis of this Daily chart of BINANCE COIN - BNB/USD indicates that the overall trend is strongly bullish. 82.14% of the signals given by moving averages are bullish. This strongly bullish trend is supported by the strong bullish signals given by short-term moving averages. The Central Indicators market scanner currently does not detect any result that concerns moving averages.
The probability of a further increase is high given the direction of the technical indicators.
But beware of excesses. The Central Indicators scanner currently detects this:
CCI indicator is overbought : over 100
Type : Neutral
Timeframe : Daily
Williams %R indicator is overbought : over -20
Type : Neutral
Timeframe : Daily
Pivot points : price is over resistance 2
Type : Neutral
Timeframe : Weekly
Parabolic SAR indicator bullish reversal
Type : Bullish
Timeframe : Daily
Price is back over the pivot point
Type : Bullish
Timeframe : Daily
Price is back under the pivot point
Type : Bearish
Timeframe : Weekly
An analysis of the price chart with the Central Patterns scanner (detector of chart patterns and resistances and supports) shows several results that can have an impact on the price change:
Horizontal resistance is broken
Type : Bullish
Timeframe : Daily
Resistance of channel is broken
Type : Bullish
Timeframe : Daily
Resistance of triangle is broken
Type : Bullish
Timeframe : Daily
Central Candlesticks, the scanner specialised in Japanese candlesticks, detects a bullish signal that could support the hypothesis of a small rebound in the very short term:
Three white soldiers
Type : Bullish
Timeframe : Daily
| S3 | S2 | S1 | Price | R1 | R2 | R3 | |
|---|---|---|---|---|---|---|---|
| ProTrendLines | 263.65 | 333.27 | 428.99 | 468.23 | 505.12 | 597.56 | 676.53 |
| Change (%) | -43.69% | -28.82% | -8.38% | - | +7.88% | +27.62% | +44.49% |
| Change | -204.58 | -134.96 | -39.24 | - | +36.89 | +129.33 | +208.30 |
| Level | Major | Intermediate | Intermediate | - | Intermediate | Minor | Major |
To determine price objectives, it is also possible to use the pivot points. Here is the price position in relation to pivot points:
| Pivot points | S3 | S2 | S1 | PP | R1 | R2 | R3 |
|---|---|---|---|---|---|---|---|
| Standard | 405.83 | 419.24 | 444.96 | 458.37 | 484.09 | 497.50 | 523.22 |
| Camarilla | 459.93 | 463.52 | 467.10 | 470.69 | 474.28 | 477.86 | 481.45 |
| Woodie | 412.00 | 422.32 | 451.13 | 461.45 | 490.26 | 500.58 | 529.39 |
| Fibonacci | 419.24 | 434.18 | 443.42 | 458.37 | 473.31 | 482.55 | 497.50 |
| Pivot points | S3 | S2 | S1 | PP | R1 | R2 | R3 |
|---|---|---|---|---|---|---|---|
| Standard | 366.69 | 389.08 | 405.47 | 427.86 | 444.25 | 466.64 | 483.03 |
| Camarilla | 411.20 | 414.75 | 418.31 | 421.86 | 425.42 | 428.97 | 432.53 |
| Woodie | 363.69 | 387.58 | 402.47 | 426.36 | 441.25 | 465.14 | 480.03 |
| Fibonacci | 389.08 | 403.89 | 413.05 | 427.86 | 442.67 | 451.83 | 466.64 |
| Pivot points | S3 | S2 | S1 | PP | R1 | R2 | R3 |
|---|---|---|---|---|---|---|---|
| Standard | 111.64 | 215.85 | 301.75 | 405.96 | 491.86 | 596.07 | 681.97 |
| Camarilla | 335.37 | 352.80 | 370.22 | 387.65 | 405.08 | 422.50 | 439.93 |
| Woodie | 102.49 | 211.27 | 292.60 | 401.38 | 482.71 | 591.49 | 672.82 |
| Fibonacci | 215.85 | 288.47 | 333.34 | 405.96 | 478.58 | 523.45 | 596.07 |
Numerical data
The following are the details of the technical indicators and moving averages that were collected to generate this technical analysis:
| RSI (14): | 63.80 | |
| MACD (12,26,9): | 13.2600 | |
| Directional Movement: | 12.19 | |
| AROON (14): | 100.00 | |
| DEMA (21): | 436.57 | |
| Parabolic SAR (0,02-0,02-0,2): | 392.41 | |
| Elder Ray (13): | 40.69 | |
| Super Trend (3,10): | 389.33 | |
| Zig ZAG (10): | 469.67 | |
| VORTEX (21): | 1.1600 | |
| Stochastique (14,3,5): | 93.39 | |
| TEMA (21): | 451.00 | |
| Williams %R (14): | -13.40 | |
| Chande Momentum Oscillator (20): | 41.88 | |
| Repulse (5,40,3): | 10.0300 | |
| ROCnROLL: | 1 | |
| TRIX (15,9): | 0.1800 | |
| Courbe Coppock: | 36.14 |
| MA7: | 434.81 | |
| MA20: | 409.30 | |
| MA50: | 424.17 | |
| MA100: | 388.09 | |
| MAexp7: | 444.13 | |
| MAexp20: | 423.47 | |
| MAexp50: | 412.74 | |
| MAexp100: | 399.31 | |
| Price / MA7: | +7.69% | |
| Price / MA20: | +14.40% | |
| Price / MA50: | +10.39% | |
| Price / MA100: | +20.65% | |
| Price / MAexp7: | +5.43% | |
| Price / MAexp20: | +10.57% | |
| Price / MAexp50: | +13.44% | |
| Price / MAexp100: | +17.26% |
About author

Online


Add a comment
Comments
0 comments on the analysis BINANCE COIN - BNB/USD - Daily