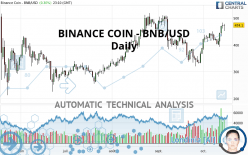
BINANCE COIN - BNB/USD - Daily - Technical analysis published on 10/15/2021 (GMT)
- 247
- 0
Click here for a new analysis!
- Timeframe : Daily
- - Analysis generated on
- Status : TARGET REACHED

Summary of the analysis

Additional analysis
Quotes
BINANCE COIN - BNB/USD rating 474.04 USD. The price has increased by +0.29% since the last closing and was between 452.33 USD and 478.16 USD. This implies that the price is at +4.80% from its lowest and at -0.86% from its highest.The Central Gaps scanner detects a bullish opening marking the presence of buyers ahead of sellers at the opening but not sufficiently marked to allow the price to register a quotation gap.
Bullish opening
Type : Bullish
Timeframe : Openning
Here is a more detailed summary of the historical variations registered by BINANCE COIN - BNB/USD:
Near a new HIGH record (1 month)
Type : Bullish
Timeframe : Weekly
Abnormal volumes on BINANCE COIN - BNB/USD were detected by the Central Volumes scanner:
Abnormal volumes
Timeframe : 5 days
Technical
Technical analysis of this Daily chart of BINANCE COIN - BNB/USD indicates that the overall trend is strongly bullish. The signals given by the moving averages are 82.14% bullish. This strong bullish trend is confirmed by the strong signals currently being given by short-term moving averages. The Central Indicators scanner detects a bearish signal on moving averages that could impact this trend:
Moving Average bearish crossovers : AMA50 & AMA100
Type : Bearish
Timeframe : Daily
An assessment of technical indicators shows a strong bullish signal.
Caution: the Central Indicators scanner currently detects an excess:
CCI indicator is overbought : over 100
Type : Neutral
Timeframe : Daily
Williams %R indicator is overbought : over -20
Type : Neutral
Timeframe : Daily
Pivot points : price is over resistance 2
Type : Neutral
Timeframe : Weekly
Price is back over the pivot point
Type : Bullish
Timeframe : Daily
Price is back under the pivot point
Type : Bearish
Timeframe : Weekly
The Central Patterns scanner, which studies chart patterns, resistances and supports, has identified these signals:
Horizontal resistance is broken
Type : Bullish
Timeframe : Daily
Resistance of channel is broken
Type : Bullish
Timeframe : Daily
Resistance of triangle is broken
Type : Bullish
Timeframe : Daily
The Central Candlesticks scanner which studies Japanese candlesticks did not detect anything.
| S3 | S2 | S1 | Price | R1 | R2 | R3 | |
|---|---|---|---|---|---|---|---|
| ProTrendLines | 263.65 | 333.27 | 428.99 | 474.04 | 505.12 | 597.56 | 676.53 |
| Change (%) | -44.38% | -29.70% | -9.50% | - | +6.56% | +26.06% | +42.72% |
| Change | -210.39 | -140.77 | -45.05 | - | +31.08 | +123.52 | +202.49 |
| Level | Major | Intermediate | Intermediate | - | Intermediate | Minor | Major |
Attention could also be paid to pivot points to set price objectives:
| Pivot points | S3 | S2 | S1 | PP | R1 | R2 | R3 |
|---|---|---|---|---|---|---|---|
| Standard | 440.61 | 451.07 | 461.87 | 472.33 | 483.13 | 493.59 | 504.39 |
| Camarilla | 466.82 | 468.77 | 470.72 | 472.67 | 474.62 | 476.57 | 478.52 |
| Woodie | 440.78 | 451.16 | 462.04 | 472.42 | 483.30 | 493.68 | 504.56 |
| Fibonacci | 451.07 | 459.19 | 464.21 | 472.33 | 480.45 | 485.47 | 493.59 |
| Pivot points | S3 | S2 | S1 | PP | R1 | R2 | R3 |
|---|---|---|---|---|---|---|---|
| Standard | 366.69 | 389.08 | 405.47 | 427.86 | 444.25 | 466.64 | 483.03 |
| Camarilla | 411.20 | 414.75 | 418.31 | 421.86 | 425.42 | 428.97 | 432.53 |
| Woodie | 363.69 | 387.58 | 402.47 | 426.36 | 441.25 | 465.14 | 480.03 |
| Fibonacci | 389.08 | 403.89 | 413.05 | 427.86 | 442.67 | 451.83 | 466.64 |
| Pivot points | S3 | S2 | S1 | PP | R1 | R2 | R3 |
|---|---|---|---|---|---|---|---|
| Standard | 111.64 | 215.85 | 301.75 | 405.96 | 491.86 | 596.07 | 681.97 |
| Camarilla | 335.37 | 352.80 | 370.22 | 387.65 | 405.08 | 422.50 | 439.93 |
| Woodie | 102.49 | 211.27 | 292.60 | 401.38 | 482.71 | 591.49 | 672.82 |
| Fibonacci | 215.85 | 288.47 | 333.34 | 405.96 | 478.58 | 523.45 | 596.07 |
Numerical data
The following is the status of technical indicators and moving averages registered at the time this technical analysis was created:
| RSI (14): | 64.42 | |
| MACD (12,26,9): | 15.6300 | |
| Directional Movement: | 9.00 | |
| AROON (14): | 92.86 | |
| DEMA (21): | 444.54 | |
| Parabolic SAR (0,02-0,02-0,2): | 396.03 | |
| Elder Ray (13): | 27.42 | |
| Super Trend (3,10): | 389.33 | |
| Zig ZAG (10): | 473.62 | |
| VORTEX (21): | 1.2200 | |
| Stochastique (14,3,5): | 92.76 | |
| TEMA (21): | 460.57 | |
| Williams %R (14): | -10.71 | |
| Chande Momentum Oscillator (20): | 42.26 | |
| Repulse (5,40,3): | 9.7900 | |
| ROCnROLL: | 1 | |
| TRIX (15,9): | 0.2500 | |
| Courbe Coppock: | 33.51 |
| MA7: | 442.98 | |
| MA20: | 415.57 | |
| MA50: | 424.12 | |
| MA100: | 389.57 | |
| MAexp7: | 452.08 | |
| MAexp20: | 428.43 | |
| MAexp50: | 415.21 | |
| MAexp100: | 400.83 | |
| Price / MA7: | +7.01% | |
| Price / MA20: | +14.07% | |
| Price / MA50: | +11.77% | |
| Price / MA100: | +21.68% | |
| Price / MAexp7: | +4.87% | |
| Price / MAexp20: | +10.66% | |
| Price / MAexp50: | +14.18% | |
| Price / MAexp100: | +18.28% |
About author

Online


Add a comment
Comments
0 comments on the analysis BINANCE COIN - BNB/USD - Daily