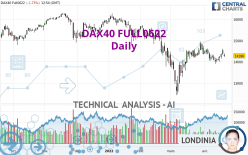
DAX40 FULL0624 - Daily - Technical analysis published on 04/22/2022 (GMT)
- 185
- 0
Click here for a new analysis!
- Timeframe : Daily
- - Analysis generated on
- Status : TARGET REACHED
Summary of the analysis

Additional analysis
Quotes
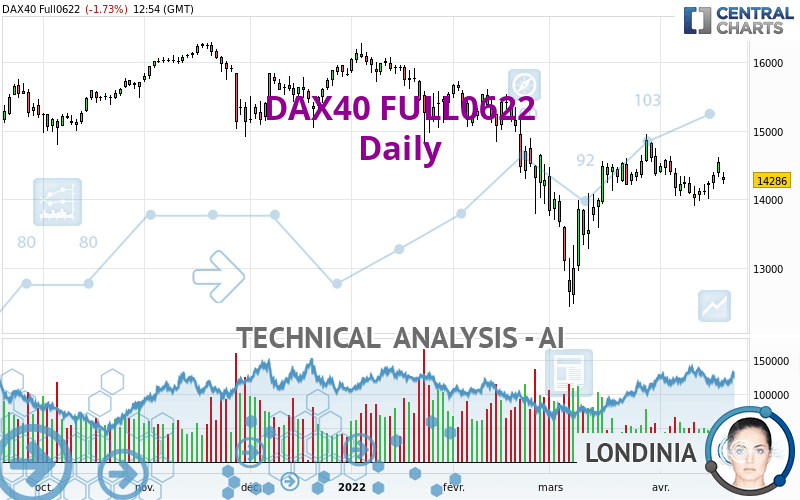
The DAX40 FULL0622 rating is 14,286.00 EUR. The price registered a decrease of -1.73% on the session and was traded between 14,224.00 EUR and 14,392.00 EUR over the period. The price is currently at +0.44% from its lowest and -0.74% from its highest.The Central Gaps scanner detects a bearish opening marking the presence of sellers ahead of buyers at the opening but not sufficiently marked to allow the price to register a quotation gap.
Bearish opening
Type : Bearish
Timeframe : Openning
A study of price movements over other periods shows the following variations:
Near a new HIGH record (1 month)
Type : Bullish
Timeframe : Weekly
Technical
A technical analysis in Daily of this DAX40 FULL0622 chart shows a sharp bearish trend. 82.14% of the signals given by moving averages are bearish. This strongly bearish trend is showing signs of slowing down given the slightly bearish signals given by short-term moving averages. An assessment of moving averages reveals several bearish and bullish signals:
Moving Average bullish crossovers : MA20 & MA50
Type : Bullish
Timeframe : Daily
Bearish price crossover with Moving Average 20
Type : Bearish
Timeframe : Daily
Bearish price crossover with Moving Average 50
Type : Bearish
Timeframe : Daily
Bearish price crossover with adaptative moving average 20
Type : Bearish
Timeframe : Daily
Bearish price crossover with adaptative moving average 50
Type : Bearish
Timeframe : Daily
In fact, only 8 technical indicators out of 18 studied are currently positioned bullish. But beware of excesses. The Central Indicators scanner currently detects this:
RSI indicator: bearish divergence
Type : Bearish
Timeframe : Daily
Pivot points : price is under support 1
Type : Neutral
Timeframe : Daily
RSI indicator is back under 50
Type : Bearish
Timeframe : Daily
Momentum indicator is back under 0
Type : Bearish
Timeframe : Daily
The analysis of the price chart with Central Patterns scanners does not return any result.
The Central Candlesticks scanner, specialised in Japanese candlesticks, did not identify any signals.
| S3 | S2 | S1 | Price | R1 | R2 | R3 | |
|---|---|---|---|---|---|---|---|
| ProTrendLines | 12,672.70 | 13,690.00 | 14,013.00 | 14,286.00 | 15,028.00 | 15,931.70 | 16,250.00 |
| Change (%) | -11.29% | -4.17% | -1.91% | - | +5.19% | +11.52% | +13.75% |
| Change | -1,613.30 | -596.00 | -273.00 | - | +742.00 | +1,645.70 | +1,964.00 |
| Level | Major | Major | Intermediate | - | Major | Intermediate | Major |
Attention could also be paid to pivot points to set price objectives:
| Pivot points | S3 | S2 | S1 | PP | R1 | R2 | R3 |
|---|---|---|---|---|---|---|---|
| Standard | 14,069.33 | 14,194.67 | 14,366.33 | 14,491.67 | 14,663.33 | 14,788.67 | 14,960.33 |
| Camarilla | 14,456.33 | 14,483.55 | 14,510.78 | 14,538.00 | 14,565.23 | 14,592.45 | 14,619.68 |
| Woodie | 14,092.50 | 14,206.25 | 14,389.50 | 14,503.25 | 14,686.50 | 14,800.25 | 14,983.50 |
| Fibonacci | 14,194.67 | 14,308.12 | 14,378.21 | 14,491.67 | 14,605.12 | 14,675.21 | 14,788.67 |
| Pivot points | S3 | S2 | S1 | PP | R1 | R2 | R3 |
|---|---|---|---|---|---|---|---|
| Standard | 13,530.33 | 13,713.67 | 13,954.33 | 14,137.67 | 14,378.33 | 14,561.67 | 14,802.33 |
| Camarilla | 14,078.40 | 14,117.27 | 14,156.13 | 14,195.00 | 14,233.87 | 14,272.73 | 14,311.60 |
| Woodie | 13,559.00 | 13,728.00 | 13,983.00 | 14,152.00 | 14,407.00 | 14,576.00 | 14,831.00 |
| Fibonacci | 13,713.67 | 13,875.64 | 13,975.70 | 14,137.67 | 14,299.64 | 14,399.70 | 14,561.67 |
| Pivot points | S3 | S2 | S1 | PP | R1 | R2 | R3 |
|---|---|---|---|---|---|---|---|
| Standard | 10,398.67 | 11,423.33 | 12,895.67 | 13,920.33 | 15,392.67 | 16,417.33 | 17,889.67 |
| Camarilla | 13,681.33 | 13,910.22 | 14,139.11 | 14,368.00 | 14,596.89 | 14,825.78 | 15,054.68 |
| Woodie | 10,622.50 | 11,535.25 | 13,119.50 | 14,032.25 | 15,616.50 | 16,529.25 | 18,113.50 |
| Fibonacci | 11,423.33 | 12,377.19 | 12,966.48 | 13,920.33 | 14,874.19 | 15,463.48 | 16,417.33 |
Numerical data
The following are the details of the technical indicators and moving averages that were collected to generate this technical analysis:
| RSI (14): | 49.65 | |
| MACD (12,26,9): | -17.1700 | |
| Directional Movement: | 0.61 | |
| AROON (14): | -57.14 | |
| DEMA (21): | 14,256.63 | |
| Parabolic SAR (0,02-0,02-0,2): | 14,662.46 | |
| Elder Ray (13): | 18.87 | |
| Super Trend (3,10): | 13,597.90 | |
| Zig ZAG (10): | 14,301.00 | |
| VORTEX (21): | 0.9600 | |
| Stochastique (14,3,5): | 59.82 | |
| TEMA (21): | 14,332.56 | |
| Williams %R (14): | -45.73 | |
| Chande Momentum Oscillator (20): | -280.00 | |
| Repulse (5,40,3): | 1.3100 | |
| ROCnROLL: | 2 | |
| TRIX (15,9): | -0.0200 | |
| Courbe Coppock: | 3.30 |
| MA7: | 14,235.57 | |
| MA20: | 14,348.95 | |
| MA50: | 14,330.50 | |
| MA100: | 14,981.33 | |
| MAexp7: | 14,297.29 | |
| MAexp20: | 14,290.85 | |
| MAexp50: | 14,463.98 | |
| MAexp100: | 14,788.25 | |
| Price / MA7: | +0.35% | |
| Price / MA20: | -0.44% | |
| Price / MA50: | -0.31% | |
| Price / MA100: | -4.64% | |
| Price / MAexp7: | -0.08% | |
| Price / MAexp20: | -0.03% | |
| Price / MAexp50: | -1.23% | |
| Price / MAexp100: | -3.40% |
About author

Online


Add a comment
Comments
0 comments on the analysis DAX40 FULL0624 - Daily