ESTOXX50 FULL0624 - Daily - Technical analysis published on 11/29/2021 (GMT)
- 190
- 0
Click here for a new analysis!
- Timeframe : Daily
- - Analysis generated on
- Status : TARGET REACHED

Summary of the analysis

Additional analysis
Quotes
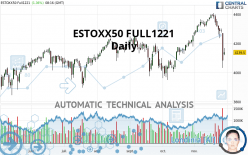
The ESTOXX50 FULL1221 price is 4,139.50 EUR. On the day, this instrument gained +1.36% with the lowest point at 4,120.00 EUR and the highest point at 4,168.00 EUR. The deviation from the price is +0.47% for the low point and -0.68% for the high point.The Central Gaps scanner detects a bullish opening. A small advantage for buyers in the very short term.
Bullish opening
Type : Bullish
Timeframe : Openning
Here is a more detailed summary of the historical variations registered by ESTOXX50 FULL1221:
Near a new LOW record (1 month)
Type : Bearish
Timeframe : Weekly
Technical
A technical analysis in Daily of this ESTOXX50 FULL1221 chart shows a slightly bearish trend. 53.57% of the signals given by moving averages are bearish. This slightly bearish trend could be reinforced by the strong bearish signals given by short-term moving averages. The Central Indicators scanner detects bearish signals on moving averages that could impact this trend:
Bearish trend reversal : Moving Average 20
Type : Bearish
Timeframe : Daily
Bearish trend reversal : adaptative moving average 50
Type : Bearish
Timeframe : Daily
Bearish trend reversal : adaptative moving average 100
Type : Bearish
Timeframe : Daily
Bearish price crossover with Moving Average 50
Type : Bearish
Timeframe : Daily
Bearish price crossover with Moving Average 100
Type : Bearish
Timeframe : Daily
Bearish price crossover with adaptative moving average 50
Type : Bearish
Timeframe : Daily
Bearish price crossover with adaptative moving average 100
Type : Bearish
Timeframe : Daily
An assessment of technical indicators shows a strong bearish signal.
Caution: the Central Indicators scanner currently detects an excess:
RSI indicator is oversold : under 30
Type : Neutral
Timeframe : Daily
CCI indicator is oversold : under -100
Type : Neutral
Timeframe : Daily
Williams %R indicator is oversold : under -80
Type : Neutral
Timeframe : Daily
Ichimoku : price is under the cloud
Type : Bearish
Timeframe : Daily
Price is back under the pivot point
Type : Bearish
Timeframe : Daily
Price is back under the pivot point
Type : Bearish
Timeframe : Weekly
The analysis of the price chart with Central Patterns scanners does not return any result.
Central Candlesticks, the scanner specialised in Japanese candlesticks, detects a bearish signal that could support the hypothesis of a small drop in the very short term:
Long black line
Type : Bearish
Timeframe : Daily
| S3 | S2 | S1 | Price | R1 | R2 | R3 | |
|---|---|---|---|---|---|---|---|
| ProTrendLines | 3,921.33 | 3,993.00 | 4,064.17 | 4,139.50 | 4,162.95 | 4,241.39 | 4,396.50 |
| Change (%) | -5.27% | -3.54% | -1.82% | - | +0.57% | +2.46% | +6.21% |
| Change | -218.17 | -146.50 | -75.33 | - | +23.45 | +101.89 | +257.00 |
| Level | Intermediate | Major | Minor | - | Major | Major | Intermediate |
Pivot points can also be used to set your price objectives. Here is the price situation in relation to pivot points:
| Pivot points | S3 | S2 | S1 | PP | R1 | R2 | R3 |
|---|---|---|---|---|---|---|---|
| Standard | 3,733.67 | 3,882.83 | 3,973.17 | 4,122.33 | 4,212.67 | 4,361.83 | 4,452.17 |
| Camarilla | 3,997.64 | 4,019.59 | 4,041.55 | 4,063.50 | 4,085.45 | 4,107.41 | 4,129.36 |
| Woodie | 3,704.25 | 3,868.13 | 3,943.75 | 4,107.63 | 4,183.25 | 4,347.13 | 4,422.75 |
| Fibonacci | 3,882.83 | 3,974.32 | 4,030.84 | 4,122.33 | 4,213.82 | 4,270.34 | 4,361.83 |
| Pivot points | S3 | S2 | S1 | PP | R1 | R2 | R3 |
|---|---|---|---|---|---|---|---|
| Standard | 3,604.33 | 3,818.17 | 3,940.83 | 4,154.67 | 4,277.33 | 4,491.17 | 4,613.83 |
| Camarilla | 3,970.96 | 4,001.81 | 4,032.65 | 4,063.50 | 4,094.35 | 4,125.19 | 4,156.04 |
| Woodie | 3,558.75 | 3,795.38 | 3,895.25 | 4,131.88 | 4,231.75 | 4,468.38 | 4,568.25 |
| Fibonacci | 3,818.17 | 3,946.71 | 4,026.12 | 4,154.67 | 4,283.21 | 4,362.62 | 4,491.17 |
| Pivot points | S3 | S2 | S1 | PP | R1 | R2 | R3 |
|---|---|---|---|---|---|---|---|
| Standard | 3,742.17 | 3,845.83 | 4,049.67 | 4,153.33 | 4,357.17 | 4,460.83 | 4,664.67 |
| Camarilla | 4,168.94 | 4,197.13 | 4,225.31 | 4,253.50 | 4,281.69 | 4,309.88 | 4,338.06 |
| Woodie | 3,792.25 | 3,870.88 | 4,099.75 | 4,178.38 | 4,407.25 | 4,485.88 | 4,714.75 |
| Fibonacci | 3,845.83 | 3,963.30 | 4,035.87 | 4,153.33 | 4,270.80 | 4,343.37 | 4,460.83 |
Numerical data
The following are the details of the technical indicators and moving averages that were collected to generate this technical analysis:
| RSI (14): | 38.07 | |
| MACD (12,26,9): | -3.0400 | |
| Directional Movement: | -31.39 | |
| AROON (14): | -42.86 | |
| DEMA (21): | 4,284.04 | |
| Parabolic SAR (0,02-0,02-0,2): | 4,338.52 | |
| Elder Ray (13): | -120.61 | |
| Super Trend (3,10): | 4,342.96 | |
| Zig ZAG (10): | 4,149.50 | |
| VORTEX (21): | 0.8800 | |
| Stochastique (14,3,5): | 22.93 | |
| TEMA (21): | 4,243.65 | |
| Williams %R (14): | -69.93 | |
| Chande Momentum Oscillator (20): | -206.50 | |
| Repulse (5,40,3): | -4.2100 | |
| ROCnROLL: | 2 | |
| TRIX (15,9): | 0.1200 | |
| Courbe Coppock: | 3.87 |
| MA7: | 4,248.86 | |
| MA20: | 4,314.77 | |
| MA50: | 4,198.44 | |
| MA100: | 4,156.12 | |
| MAexp7: | 4,225.71 | |
| MAexp20: | 4,270.19 | |
| MAexp50: | 4,227.42 | |
| MAexp100: | 4,156.98 | |
| Price / MA7: | -2.57% | |
| Price / MA20: | -4.06% | |
| Price / MA50: | -1.40% | |
| Price / MA100: | -0.40% | |
| Price / MAexp7: | -2.04% | |
| Price / MAexp20: | -3.06% | |
| Price / MAexp50: | -2.08% | |
| Price / MAexp100: | -0.42% |
About author

Online


Add a comment
Comments
0 comments on the analysis ESTOXX50 FULL0624 - Daily