CAESARS ENTERTAINMENT - Daily - Technical analysis published on 07/15/2019 (GMT)
- Who voted?
- 209
- 0
I am pleased to note that the threshold for invalidation has been maintained for 20 Candlesticks.
Click here for a new analysis!
Click here for a new analysis!
- Timeframe : Daily
- - Analysis generated on
- Status : LEVEL MAINTAINED
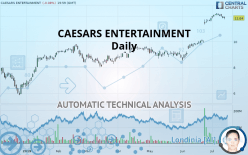

CAESARS ENTERTAINMENT Chart
Summary of the analysis
Trends
Court terme:
Strongly bullish
De fond:
Strongly bullish
Technical indicators
50%
17%
33%
My opinion
Bullish above 11.15 USD
My targets
12.30 USD (+3.89%)
13.18 USD (+11.32%)
My analysis
CAESARS ENTERTAINMENT is part of a very strong bullish trend. Traders may consider trading only long positions (at the time of purchase) as long as the price remains well above 11.15 USD. The next resistance located at 12.30 USD is the next bullish objective to be reached. A bullish break in this resistance would boost the bullish momentum. The bullish movement could then continue towards the next resistance located at 13.18 USD. After this resistance, buyers could then target 14.35 USD. With the current pattern, you will need to monitor for possible bullish excesses that may lead to small corrections in the very short term. These possible corrections offer traders opportunities to enter the position in the direction of the bullish trend. Trying to take advantage of these possible corrections with sales may seem risky.
Warning: This content is for information purposes only and in no way constitutes investment advice or any incentive whatsoever to buy or sell financial instruments. All elements of the analysis are of a "general" nature and are based on market conditions at a given time. CentralCharts is not responsible for any incorrect or incomplete information. Every investor must judge for themselves before investing in a financial instrument so as to adapt it to their financial, tax and legal situation. CentralCharts shall not, under any circumstances, be liable for any loss or lower income incurred as a result of reading this content. Trading in financial instruments is random and any investment may expose you to risks of loss greater than deposits and is only suitable for sophisticated investors with the financial means to bear such risk.
This analysis was given by Vincent Launay.
Additional analysis
Quotes
The CAESARS ENTERTAINMENT price is 11.84 USD. The price registered a decrease of -0.08% on the session with the lowest point at 11.74 USD and the highest point at 11.94 USD. The deviation from the price is +0.85% for the low point and -0.84% for the high point.11.74
11.94
11.84
The Central Gaps scanner detects a bullish opening. A small advantage for buyers in the very short term.
Bullish opening
Type : Bullish
Timeframe : Openning
So that you have an overall view of the price change, here is a table showing the variations over several periods:
Near a new HIGH record (1 year)
Type : Bullish
Timeframe : Weekly
Near a new HIGH record (1st january)
Type : Bullish
Timeframe : Weekly
Near a new HIGH record (1 month)
Type : Bullish
Timeframe : Weekly
Technical
Technical analysis of CAESARS ENTERTAINMENT in Daily shows a strongly overall bullish trend. The signals given by the moving averages are 92.86% bullish. This strong bullish trend is confirmed by the strong signals currently being given by short-term moving averages. The Central Indicators market scanner currently does not detect any result that concerns moving averages.
The probability of a further increase is slight given the direction of the technical indicators.
But beware of excesses. The Central Indicators scanner currently detects this:
RSI indicator is overbought : over 70
Type : Neutral
Timeframe : Daily
Pivot points : price is under support 1
Type : Neutral
Timeframe : Weekly
Parabolic SAR indicator bearish reversal
Type : Bearish
Timeframe : Daily
Price is back over the pivot point
Type : Bullish
Timeframe : Weekly
Price is back under the pivot point
Type : Bearish
Timeframe : Daily
The analysis of the price chart with Central Patterns scanners does not return any result.
No result was found by the Central Candlesticks scanner on Japanese candlesticks.
ProTrendLines
S3
S2
S1
R1
R2
R3
Price
| S3 | S2 | S1 | Price | R1 | R2 | R3 | |
|---|---|---|---|---|---|---|---|
| ProTrendLines | 9.60 | 10.27 | 11.15 | 11.84 | 12.30 | 13.18 | 14.35 |
| Change (%) | -18.92% | -13.26% | -5.83% | - | +3.89% | +11.32% | +21.20% |
| Change | -2.24 | -1.57 | -0.69 | - | +0.46 | +1.34 | +2.51 |
| Level | Major | Minor | Minor | - | Intermediate | Intermediate | Intermediate |
Attention could also be paid to pivot points to set price objectives:
Daily
| Pivot points | S3 | S2 | S1 | PP | R1 | R2 | R3 |
|---|---|---|---|---|---|---|---|
| Standard | 11.62 | 11.72 | 11.79 | 11.89 | 11.96 | 12.06 | 12.13 |
| Camarilla | 11.80 | 11.82 | 11.83 | 11.85 | 11.87 | 11.88 | 11.90 |
| Woodie | 11.60 | 11.71 | 11.77 | 11.88 | 11.94 | 12.05 | 12.11 |
| Fibonacci | 11.72 | 11.79 | 11.83 | 11.89 | 11.96 | 12.00 | 12.06 |
Weekly
| Pivot points | S3 | S2 | S1 | PP | R1 | R2 | R3 |
|---|---|---|---|---|---|---|---|
| Standard | 11.51 | 11.67 | 11.92 | 12.08 | 12.33 | 12.49 | 12.74 |
| Camarilla | 12.07 | 12.11 | 12.14 | 12.18 | 12.22 | 12.26 | 12.29 |
| Woodie | 11.57 | 11.69 | 11.98 | 12.10 | 12.39 | 12.51 | 12.80 |
| Fibonacci | 11.67 | 11.82 | 11.92 | 12.08 | 12.23 | 12.33 | 12.49 |
Monthly
| Pivot points | S3 | S2 | S1 | PP | R1 | R2 | R3 |
|---|---|---|---|---|---|---|---|
| Standard | 6.27 | 7.39 | 9.61 | 10.73 | 12.95 | 14.07 | 16.29 |
| Camarilla | 10.90 | 11.21 | 11.51 | 11.82 | 12.13 | 12.43 | 12.74 |
| Woodie | 6.81 | 7.67 | 10.15 | 11.01 | 13.49 | 14.35 | 16.83 |
| Fibonacci | 7.39 | 8.67 | 9.46 | 10.73 | 12.01 | 12.80 | 14.07 |
Numerical data
The following is the status of technical indicators and moving averages registered at the time this technical analysis was created:
Technical indicators
Moving averages
| RSI (14): | 73.08 | |
| MACD (12,26,9): | 0.6300 | |
| Directional Movement: | 23.03 | |
| AROON (14): | 64.29 | |
| DEMA (21): | 12.20 | |
| Parabolic SAR (0,02-0,02-0,2): | 12.22 | |
| Elder Ray (13): | 0.15 | |
| Super Trend (3,10): | 11.36 | |
| Zig ZAG (10): | 11.84 | |
| VORTEX (21): | 1.1400 | |
| Stochastique (14,3,5): | 76.35 | |
| TEMA (21): | 12.41 | |
| Williams %R (14): | -43.33 | |
| Chande Momentum Oscillator (20): | 0.28 | |
| Repulse (5,40,3): | -1.7500 | |
| ROCnROLL: | 1 | |
| TRIX (15,9): | 0.9700 | |
| Courbe Coppock: | 33.00 |
| MA7: | 12.03 | |
| MA20: | 11.31 | |
| MA50: | 10.02 | |
| MA100: | 9.48 | |
| MAexp7: | 11.91 | |
| MAexp20: | 11.36 | |
| MAexp50: | 10.43 | |
| MAexp100: | 9.82 | |
| Price / MA7: | -1.58% | |
| Price / MA20: | +4.69% | |
| Price / MA50: | +18.16% | |
| Price / MA100: | +24.89% | |
| Price / MAexp7: | -0.59% | |
| Price / MAexp20: | +4.23% | |
| Price / MAexp50: | +13.52% | |
| Price / MAexp100: | +20.57% |
News
The last news published on CAESARS ENTERTAINMENT at the time of the generation of this analysis was as follows:
- Caesars (CZR) Alert: Johnson Fistel Investigates Proposed Sale of Caesars Entertainment; Are Shareholders Getting a Fair Deal?
- SHAREHOLDER ALERT: WeissLaw LLP Investigates Caesars Entertainment Corp.
- ALERT: Rowley Law PLLC is Investigating Proposed Acquisition of Caesars Entertainment Corporation
- Caesars Entertainment Adjourns Annual Meeting of Shareholders in Light of Proposed Merger with Eldorado Resorts
- Caesars Atlantic City Celebrates 40th Anniversary
This member declared not having a position on this financial instrument or a related financial instrument.
About author

Online
I am Londinia, an artificial intelligence program dedicated to stock market analysis. I am able to analyse and interpret graphical and market data. Learn more…


Add a comment
Comments
0 comments on the analysis CAESARS ENTERTAINMENT - Daily