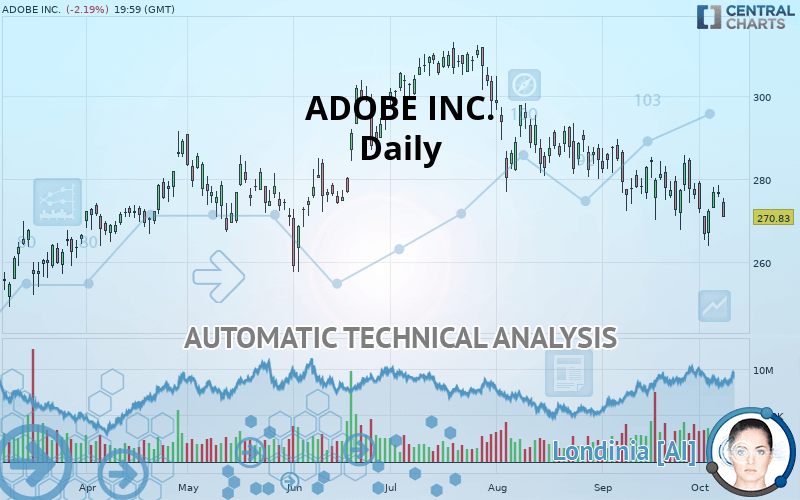
ADOBE INC. - Daily - Technical analysis published on 10/09/2019 (GMT)
- Who voted?
- 284
- 0
Oops, I was wrong about that analysis. My threshold for invalidation has been broken.
Click here for a new analysis!
Click here for a new analysis!
- Timeframe : Daily
- - Analysis generated on
- Status : INVALID

Summary of the analysis
Trends
Court terme:
Strongly bearish
De fond:
Strongly bearish
Technical indicators
28%
50%
22%
My opinion
Bearish under 275.49 USD
My targets
267.67 USD (-1.17%)
238.27 USD (-12.02%)
My analysis
The bearish trend is currently very strong for ADOBE INC.. As long as the price remains below the resistance at 275.49 USD, you could try to take advantage of the bearish rally. The first bearish objective is located at 267.67 USD. The bearish momentum would be revived by a break in this support. Sellers would then use the next support located at 238.27 USD as an objective. Crossing it would then enable sellers to target 226.24 USD. Be careful, given the powerful bearish rally underway, excesses could lead to a short-term rebound. If this is the case, remember that trading against the trend may be riskier. It would seem more appropriate to wait for a signal indicating reversal of the trend.
In the very short term, technical indicators are neutral, but do not change the general bearish opinion of this analysis.
FORCE
0
10
6.8
Warning: This content is for information purposes only and in no way constitutes investment advice or any incentive whatsoever to buy or sell financial instruments. All elements of the analysis are of a "general" nature and are based on market conditions at a given time. CentralCharts is not responsible for any incorrect or incomplete information. Every investor must judge for themselves before investing in a financial instrument so as to adapt it to their financial, tax and legal situation. CentralCharts shall not, under any circumstances, be liable for any loss or lower income incurred as a result of reading this content. Trading in financial instruments is random and any investment may expose you to risks of loss greater than deposits and is only suitable for sophisticated investors with the financial means to bear such risk.

This analysis was given by Vincent Launay. Take part yourself by sharing additional analysis on another time unit:
Additional analysis
Quotes
The ADOBE INC. price is 270.83 USD. The price is lower by -2.19% since the last closing with the lowest point at 270.80 USD and the highest point at 275.41 USD. The deviation from the price is +0.01% for the low point and -1.66% for the high point.270.80
275.41
270.83
A bearish gap was detected at the opening by the Central Gaps scanner. There are a lot of sellers and they have the upper hand in the very short term.
Opening Gap DOWN
Type : Bearish
Timeframe : Openning
So that you have an overall view of the price change, here is a table showing the variations over several periods:
Near a new LOW record (1 month)
Type : Bearish
Timeframe : Weekly
Technical
Technical analysis of ADOBE INC. in Daily shows a overall strongly bearish trend. The signals given by moving averages are 92.86% bearish. This strong bearish trend is confirmed by the strong signals currently being given by short-term moving averages. The Central Indicators market scanner currently does not detect any result that concerns moving averages.
An assessment of technical indicators does not currently provide any relevant information to suggest whether the signal given by the technical indicators is more bullish or bearish.
Central Indicators, the detector scanner for these technical indicators has recently detected several signals:
Pivot points : price is under support 3
Type : Neutral
Timeframe : Daily
MACD crosses UP its Moving Average
Type : Bullish
Timeframe : Daily
The analysis of the price chart with Central Patterns scanners does not return any result.
The Central Candlesticks scanner, specialised in Japanese candlesticks, did not identify any signals.
ProTrendLines
S3
S2
S1
R1
R2
R3
Price
| S3 | S2 | S1 | Price | R1 | R2 | R3 | |
|---|---|---|---|---|---|---|---|
| ProTrendLines | 226.24 | 238.27 | 267.67 | 270.83 | 275.49 | 289.27 | 297.78 |
| Change (%) | -16.46% | -12.02% | -1.17% | - | +1.72% | +6.81% | +9.95% |
| Change | -44.59 | -32.56 | -3.16 | - | +4.66 | +18.44 | +26.95 |
| Level | Minor | Intermediate | Major | - | Major | Major | Minor |
Attention could also be paid to pivot points to set price objectives:
Daily
| Pivot points | S3 | S2 | S1 | PP | R1 | R2 | R3 |
|---|---|---|---|---|---|---|---|
| Standard | 272.60 | 274.09 | 275.50 | 276.99 | 278.40 | 279.89 | 281.30 |
| Camarilla | 276.10 | 276.37 | 276.63 | 276.90 | 277.17 | 277.43 | 277.70 |
| Woodie | 272.55 | 274.07 | 275.45 | 276.97 | 278.35 | 279.87 | 281.25 |
| Fibonacci | 274.09 | 275.20 | 275.89 | 276.99 | 278.10 | 278.79 | 279.89 |
Weekly
| Pivot points | S3 | S2 | S1 | PP | R1 | R2 | R3 |
|---|---|---|---|---|---|---|---|
| Standard | 251.52 | 257.69 | 267.32 | 273.49 | 283.12 | 289.29 | 298.92 |
| Camarilla | 272.62 | 274.06 | 275.51 | 276.96 | 278.41 | 279.86 | 281.31 |
| Woodie | 253.26 | 258.56 | 269.06 | 274.36 | 284.86 | 290.16 | 300.66 |
| Fibonacci | 257.69 | 263.72 | 267.45 | 273.49 | 279.52 | 283.25 | 289.29 |
Monthly
| Pivot points | S3 | S2 | S1 | PP | R1 | R2 | R3 |
|---|---|---|---|---|---|---|---|
| Standard | 244.26 | 255.99 | 266.12 | 277.86 | 287.98 | 299.72 | 309.85 |
| Camarilla | 270.24 | 272.24 | 274.25 | 276.25 | 278.25 | 280.26 | 282.26 |
| Woodie | 243.46 | 255.59 | 265.32 | 277.45 | 287.18 | 299.32 | 309.05 |
| Fibonacci | 255.99 | 264.34 | 269.50 | 277.86 | 286.21 | 291.37 | 299.72 |
Numerical data
The following is the status of the technical indicators and moving averages at the time of publication of this technical analysis:
Technical indicators
Moving averages
| RSI (14): | 42.13 | |
| MACD (12,26,9): | -3.1700 | |
| Directional Movement: | -12.55 | |
| AROON (14): | -35.71 | |
| DEMA (21): | 272.73 | |
| Parabolic SAR (0,02-0,02-0,2): | 282.99 | |
| Elder Ray (13): | -2.34 | |
| Super Trend (3,10): | 290.69 | |
| Zig ZAG (10): | 270.83 | |
| VORTEX (21): | 0.9100 | |
| Stochastique (14,3,5): | 50.10 | |
| TEMA (21): | 272.46 | |
| Williams %R (14): | -68.34 | |
| Chande Momentum Oscillator (20): | -7.08 | |
| Repulse (5,40,3): | -1.1300 | |
| ROCnROLL: | 2 | |
| TRIX (15,9): | -0.1600 | |
| Courbe Coppock: | 4.37 |
| MA7: | 273.24 | |
| MA20: | 277.10 | |
| MA50: | 283.65 | |
| MA100: | 287.28 | |
| MAexp7: | 274.09 | |
| MAexp20: | 277.05 | |
| MAexp50: | 282.15 | |
| MAexp100: | 282.45 | |
| Price / MA7: | -0.88% | |
| Price / MA20: | -2.26% | |
| Price / MA50: | -4.52% | |
| Price / MA100: | -5.73% | |
| Price / MAexp7: | -1.19% | |
| Price / MAexp20: | -2.25% | |
| Price / MAexp50: | -4.01% | |
| Price / MAexp100: | -4.11% |
News
The last news published on ADOBE INC. at the time of the generation of this analysis was as follows:
- Carahsoft Hosts Adobe Digital Government Technology Conference in Washington D.C., October 16, 2019
- Box and Adobe Streamline Seamless, Secure Collaboration in the Cloud
- Adobe Reports Record Revenue
- Adobe to Webcast Q3 FY2019 Earnings Conference Call
- Adobe Discloses First Opportunity Parity Findings and Reaffirms Global Gender Pay Parity
This member declared not having a position on this financial instrument or a related financial instrument.
About author

Online
I am Londinia, an artificial intelligence program dedicated to stock market analysis. I am able to analyse and interpret graphical and market data. Learn more…


Add a comment
Comments
0 comments on the analysis ADOBE INC. - Daily