Trading strategies with moving averages
-
- 0
- 1082
- 0
Moving averages are a very effective decision support tool. They can identify the trend and also give trading signals. There are several ways to use moving averages in trading. The first is to compare the moving average with the price curve. This is the most traditional use. A second method is to trade on moving average crossovers.
A rising moving average is a sign of a rising trend and a falling moving average is a sign of a falling trend. That is the basic principle. But what if we compare the moving average to the price? This trend indicator can help you determine a direction to trade (see: One-way trading). Several scenarios may arise:
- Bullish moving average with prices above this average > Only long positions
- Bullish moving average with prices below this average > Only short positions
- Bearish moving average with prices below this average > Only short positions
- Bearish moving average with prices above this average > Only long positions
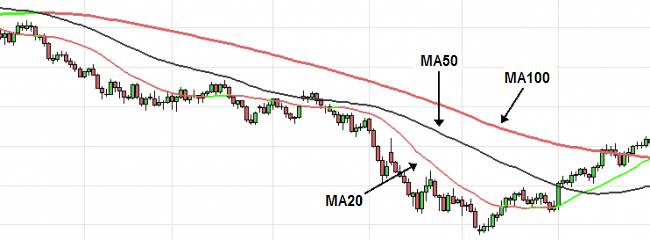
But be careful, a break in the moving average price does not necessarily mean that there will be a trend reversal. It can be a simple correction/rebound. It all depends on your moving average’s period. The longer this period, the fewer false signals you have, but on the other hand, trend reversals take a long time to detect. Conversely, a short period increases the moving average reactivity (which detects reversals more quickly) but with a large number of false signals. It is therefore a matter of finding a good compromise depending on your trading strategy. If you are an aggressive scalper or trader, you should favour short moving averages. On the other hand, if you are a swing trader, you should favour long moving averages. Here is an example showing you different periods:
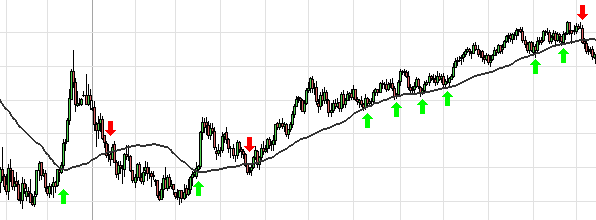
The moving average to price comparison can also be used to obtain trading signals:
- Bearish moving average crossover with price >Sell signal
- Bullish moving average crossover with price > Buy signal
- Price rebound on a bullish moving average > Buy Signal
- Price correction on a bearish moving average > Sell signal
Here is a chart showing the trading signals given by a moving average:
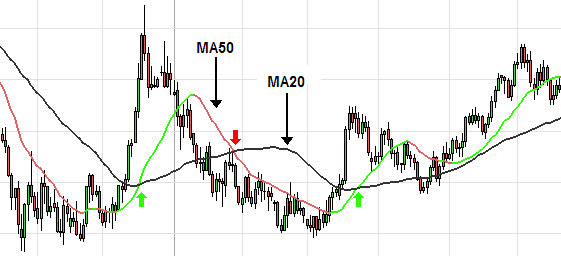
Moving average crossovers also give trading signals. To do this, add two moving averages to your chart, one short-term (used to give you trading signals) and another longer-term (which gives the trend). For example, you can use MA20 and MA50, or MA50 and MA200. The longer the period difference between your two moving averages, the more trading signals you will have but with a lot of false signals. Conversely, a short gap between two MAs limits false signals. It is a matter of finding a good compromise. Here are the signals given by a crossover in moving averages :
- Bullish crossover of a short moving average with a long moving average > Buy signal
- Bearish crossover of a short moving average with a long moving average > Sell signal
Here is an example with an MA20 and an MA50:
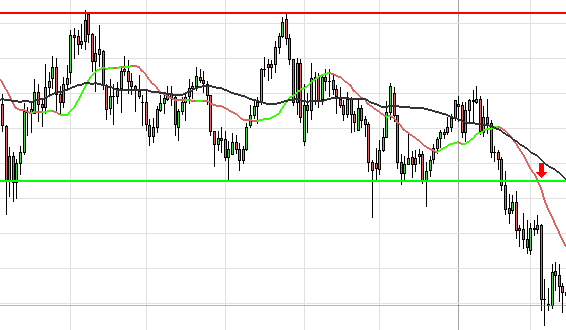
There are various means of detecting false signals in moving average crossovers :
- Short spacing of moving averages after crossover
- Turnaround of the short-term moving average after crossover with the long-term moving average
- multiple crossovers.
These elements also make it possible to detect that we are in a period of uncertainty with no real trend. It is better in this case to ignore the signals until you have a clear signal. It is then necessary to use other technical analysis elements to make the end of a phase of indecision clearer (break of a support, resistance, exit from chart patterns, etc.). Here is an example with a range:
Strategy 1: Comparison of moving average to price
A rising moving average is a sign of a rising trend and a falling moving average is a sign of a falling trend. That is the basic principle. But what if we compare the moving average to the price? This trend indicator can help you determine a direction to trade (see: One-way trading). Several scenarios may arise:
- Bullish moving average with prices above this average > Only long positions
- Bullish moving average with prices below this average > Only short positions
- Bearish moving average with prices below this average > Only short positions
- Bearish moving average with prices above this average > Only long positions
But be careful, a break in the moving average price does not necessarily mean that there will be a trend reversal. It can be a simple correction/rebound. It all depends on your moving average’s period. The longer this period, the fewer false signals you have, but on the other hand, trend reversals take a long time to detect. Conversely, a short period increases the moving average reactivity (which detects reversals more quickly) but with a large number of false signals. It is therefore a matter of finding a good compromise depending on your trading strategy. If you are an aggressive scalper or trader, you should favour short moving averages. On the other hand, if you are a swing trader, you should favour long moving averages. Here is an example showing you different periods:
The moving average to price comparison can also be used to obtain trading signals:
- Bearish moving average crossover with price >Sell signal
- Bullish moving average crossover with price > Buy signal
- Price rebound on a bullish moving average > Buy Signal
- Price correction on a bearish moving average > Sell signal
Here is a chart showing the trading signals given by a moving average:
Strategy 2: Moving average crossovers
Moving average crossovers also give trading signals. To do this, add two moving averages to your chart, one short-term (used to give you trading signals) and another longer-term (which gives the trend). For example, you can use MA20 and MA50, or MA50 and MA200. The longer the period difference between your two moving averages, the more trading signals you will have but with a lot of false signals. Conversely, a short gap between two MAs limits false signals. It is a matter of finding a good compromise. Here are the signals given by a crossover in moving averages :
- Bullish crossover of a short moving average with a long moving average > Buy signal
- Bearish crossover of a short moving average with a long moving average > Sell signal
Here is an example with an MA20 and an MA50:
There are various means of detecting false signals in moving average crossovers :
- Short spacing of moving averages after crossover
- Turnaround of the short-term moving average after crossover with the long-term moving average
- multiple crossovers.
These elements also make it possible to detect that we are in a period of uncertainty with no real trend. It is better in this case to ignore the signals until you have a clear signal. It is then necessary to use other technical analysis elements to make the end of a phase of indecision clearer (break of a support, resistance, exit from chart patterns, etc.). Here is an example with a range:


