Understanding trend lines
-
- 1
- Who voted?
- 2400
- 0
A trend line is an ascending (or descending) line makes a support (or resistance). Trend lines are the basis of technical analysis. They enable you to identify the asset’s background trend and can be used on all time units.
In a bullish trend, the trend line connects the low (or trough) points that occurred in a bullish movement. Example:
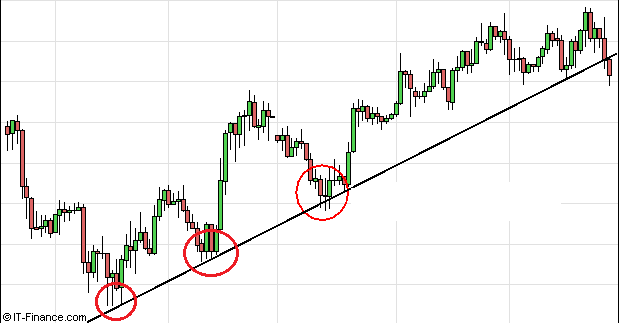
Third contact point which validates the trend line
To draw your bullish trend line, take a low point and connect it to a second low point above the first.
In a bearish trend, the trend line links the high points (or peaks) that occurred within a bearish movement. Example:
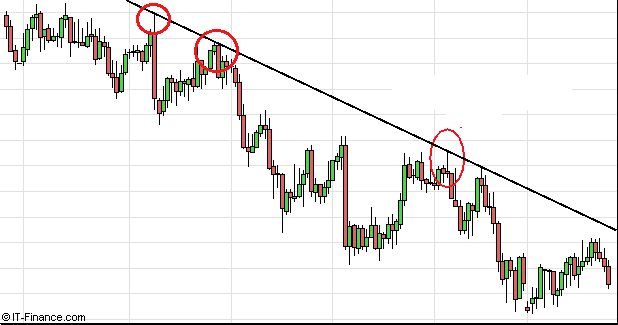
To draw your bearish trend line, take a high point and connect it to a second high point above the first.
A trend line is validated from the third contact point with the price line but it is possible to draw a trend line with only two points.
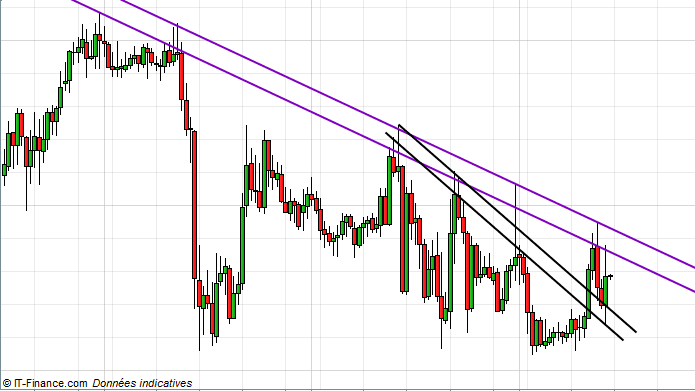
To connect the high/low points of a trend line, the question often arises as to whether or not it is better to take into account the candlesticks’ wicks. Remember that the objective of a trend line is to connect as many high/low points as possible. Your trend line may or may not cut the wicks, it doesn't matter. To optimize the layout of your trend line, it is better to work with trend areas rather than simple lines. Example:
A break in a trend line indicates that a technical rebound/correction is likely, but this does not mean that a trend reversal will occur. It is impossible to anticipate the magnitude of the rebound/correction with this element alone. The break in a trend line is confirmed if a candlestick closes below or above the trend line. Let’s consider an example:
On the chart we see that the first break in the trend line leads to a simple horizontal consolidation. In both cases, a trend reversal occurs. This example shows us an essential point for using the break in a trend line in your trading, it is the strength of the movement. In the first case, the break occurs on a small candlestick while in the second case, the break occurs on a large bearish candlestick. The larger the candlestick that breaks, the greater the probability of a major correction or possible trend reversal.
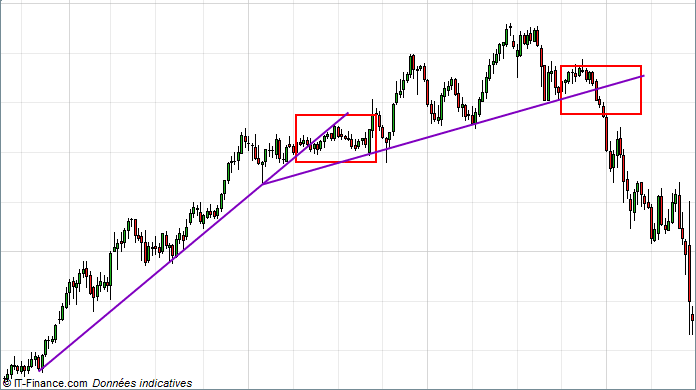
In many cases, the break in a trend line leads to a simple technical correction within a consolidation flag (continuation pattern) or towards a nearby major support line.
We can see in the above example that once the bullish trend line is broken, a technical correction occurs and is implemented within a consolidation flag. This consolidation can continue up to the major support line (purple support line).
- The more contact points that a trend line has with the price, the greater the probability of a break. At the third contact point, the probabilities are very low. At the fourth, they are high and at the fifth test, they are very high. Remember one thing, a trend line always ends up being broken.
- Trend line breaks most often reflect a loss of momentum rather than a trend reversal.
- The steeper the trend line, the faster it breaks - The more contact points with the trend line there are, the higher the probability of a significant correction at the time of the break.
- To identify price objectives after a trend line break, focus on Fibonacci retracements starting from the first contact point with the straight line and ending with the highest contact point with the break.
- Pullbacks are frequent on trend lines
Strategy 1:
Once the trend line has been identified, only trade long positions in the case of a bullish trend line and short positions in the case of a bearish trend line. Focus on one way trading.
Strategy 2:
Enter short/long at the break in the bearish/bullish trend line using Fibonacci retracements or a major support/resistance line for a price objective.
Strategy 3:
Wait until the end of the technical correction (a bearish/bullish recovery pattern, a return to above/below the trend line, a break at the highest/lowest point, a break in a resistance/support line, etc.) to open a position in the direction of the background trend.
Plot a trend line
Bullish trend line
In a bullish trend, the trend line connects the low (or trough) points that occurred in a bullish movement. Example:
Third contact point which validates the trend line
To draw your bullish trend line, take a low point and connect it to a second low point above the first.
Bearish trend line
In a bearish trend, the trend line links the high points (or peaks) that occurred within a bearish movement. Example:
To draw your bearish trend line, take a high point and connect it to a second high point above the first.
Validation of a trend line
A trend line is validated from the third contact point with the price line but it is possible to draw a trend line with only two points.
Trend line or trend area
To connect the high/low points of a trend line, the question often arises as to whether or not it is better to take into account the candlesticks’ wicks. Remember that the objective of a trend line is to connect as many high/low points as possible. Your trend line may or may not cut the wicks, it doesn't matter. To optimize the layout of your trend line, it is better to work with trend areas rather than simple lines. Example:
Break in a trend line
A break in a trend line indicates that a technical rebound/correction is likely, but this does not mean that a trend reversal will occur. It is impossible to anticipate the magnitude of the rebound/correction with this element alone. The break in a trend line is confirmed if a candlestick closes below or above the trend line. Let’s consider an example:
On the chart we see that the first break in the trend line leads to a simple horizontal consolidation. In both cases, a trend reversal occurs. This example shows us an essential point for using the break in a trend line in your trading, it is the strength of the movement. In the first case, the break occurs on a small candlestick while in the second case, the break occurs on a large bearish candlestick. The larger the candlestick that breaks, the greater the probability of a major correction or possible trend reversal.
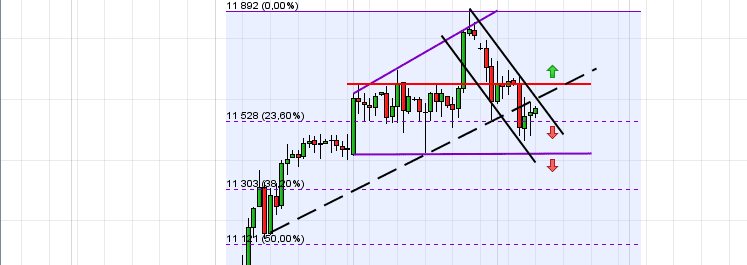
In many cases, the break in a trend line leads to a simple technical correction within a consolidation flag (continuation pattern) or towards a nearby major support line.
We can see in the above example that once the bullish trend line is broken, a technical correction occurs and is implemented within a consolidation flag. This consolidation can continue up to the major support line (purple support line).
Notes on trading on trend lines
- The more contact points that a trend line has with the price, the greater the probability of a break. At the third contact point, the probabilities are very low. At the fourth, they are high and at the fifth test, they are very high. Remember one thing, a trend line always ends up being broken.
- Trend line breaks most often reflect a loss of momentum rather than a trend reversal.
- The steeper the trend line, the faster it breaks - The more contact points with the trend line there are, the higher the probability of a significant correction at the time of the break.
- To identify price objectives after a trend line break, focus on Fibonacci retracements starting from the first contact point with the straight line and ending with the highest contact point with the break.
- Pullbacks are frequent on trend lines
Strategies for trading with trend lines
Strategy 1:
Once the trend line has been identified, only trade long positions in the case of a bullish trend line and short positions in the case of a bearish trend line. Focus on one way trading.
Strategy 2:
Enter short/long at the break in the bearish/bullish trend line using Fibonacci retracements or a major support/resistance line for a price objective.
Strategy 3:
Wait until the end of the technical correction (a bearish/bullish recovery pattern, a return to above/below the trend line, a break at the highest/lowest point, a break in a resistance/support line, etc.) to open a position in the direction of the background trend.


