Continuation chart patterns
-
- 0
- 5677
- 2
Continuation chart patterns announce a continuation of the current trend on the observed chart. The pattern exits in the direction of the movement preceding the pattern’s formation. In a bearish trend, a continuation pattern indicates a continuation of the bearish movement. In a bullish trend, the pattern indicates a continuation of the bullish movement.
Continuation chart patterns allow for the asset to consolidate the current trend movement without questioning it. These patterns are very frequently found on price charts. Continuation patterns suggest entry points to take advantage of the trend, but don’t be hasty, no matter how much consolidation there is within the pattern, it is better to wait for a signal indicating the trend’s resumption before opening a position. This signal can be a reversal following a point of contact with one of the pattern’s lines or an exit of the continuation pattern in the direction of the trend.
Some continuity patterns are more relevant than others. I suggest that you consult the fact sheet on "Trading on chart patterns” to identify those with the best success rates, those most often achieving their objectives and those which regularly pullback on the signal line.
Here is a list of the continuation chart patterns:
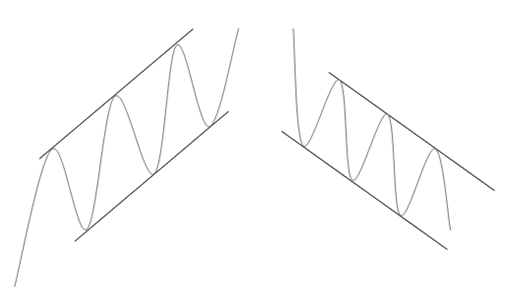
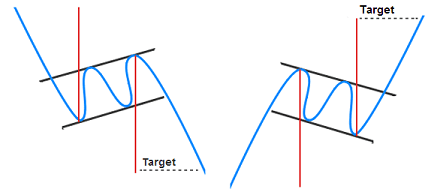
- Bullish channel / Bearish channel
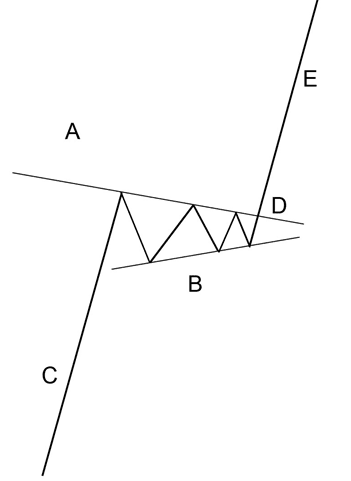
- Pennant
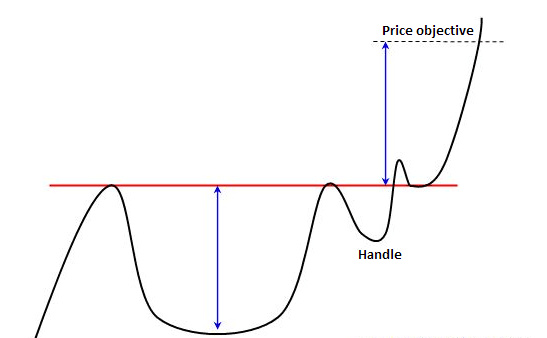
- Cup with handle
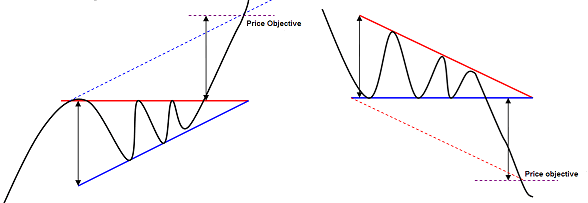
- Ascending triangle / Descending triangle
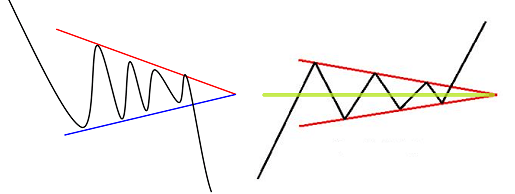
- Bearish symmetrical triangle / Bullish symmetrical triangle
- Bearish flag / Bullish flag
Continuation chart patterns allow for the asset to consolidate the current trend movement without questioning it. These patterns are very frequently found on price charts. Continuation patterns suggest entry points to take advantage of the trend, but don’t be hasty, no matter how much consolidation there is within the pattern, it is better to wait for a signal indicating the trend’s resumption before opening a position. This signal can be a reversal following a point of contact with one of the pattern’s lines or an exit of the continuation pattern in the direction of the trend.
Some continuity patterns are more relevant than others. I suggest that you consult the fact sheet on "Trading on chart patterns” to identify those with the best success rates, those most often achieving their objectives and those which regularly pullback on the signal line.
Here is a list of the continuation chart patterns:
- Bullish channel / Bearish channel
- Pennant
- Cup with handle
- Ascending triangle / Descending triangle
- Bearish symmetrical triangle / Bullish symmetrical triangle
- Bearish flag / Bullish flag


