Chart pattern: Ascending triangle
-
- 0
- 10557
- 0
What is an ascending triangle?
An ascending triangle is a bullish continuation chart pattern. The pattern is formed by two converging lines.
The first straight line is a supporting bullish oblique, also known as the "ascending triangle support line".
The second line is a horizontal resistance, also known as the "ascending triangle resistance line".
An ascending triangle is confirmed/valid if it has good oscillation between the two lines.
Each of these lines must have been touched at least twice to validate the pattern.
NB: a line is said to be "valid" if the price line touches the support or resistance at least 3 times.
This implies that the ascending triangle pattern is considered valid if the price touches the support line at least 3 times and the resistance line twice (or the support line at least twice and the resistance line 3 times).
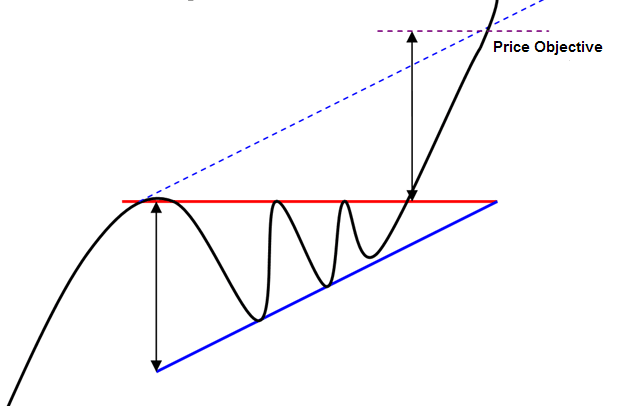
An ascending triangle’s price objective is determined by the high point of the triangle’s base, which is plotted on the break out point (above the resistance). Another technique consists of drawing a line parallel to the ascending triangle support line, from the first contact with the resistance.
Graphical representation of an ascending triangle
Ascending triangle statistics
- In 62% of cases, the exit is bullish.
- In 75% of cases, an ascending triangle is a continuation pattern.
- In 75% of cases, the triangle's price objective is reached when the resistance is broken (exit from the ascending triangle).
- In 60% of cases, the price makes a pullback after exit in support on the triangle's resistance line.
- In 25% of cases, the price line indicates false line breaks or false triangle exits.
Notes on ascending triangles
- The exit most often occurs at 2/3 of the triangle’s length. The exit level offers the best performance.
- The ascending triangle’s price objective is generally obtained before the tip of the triangle (intersection of the two lines forming the triangle).
- False breaks give no indication of the true direction of exit.
- Avoid taking a position if the break/exit occurs before 2/3 of the triangle’s length.
- Pullbacks in support on the ascending triangle’s resistance line are detrimental to performance.
For your information: An ascending triangle is a continuation chart pattern. Its opposite is a descending triangle.


