Chart pattern: Bullish symmetrical triangle
-
- 0
- 17262
- 0
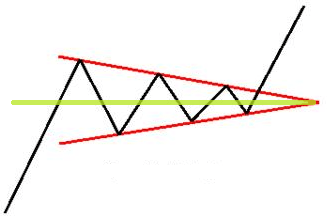
A bullish symmetrical triangle is a bullish continuation chart pattern. The pattern is formed by two converging trend lines that are symmetrical in relation to the horizontal line.
The first line is a bearish trend line creating the resistance, also called the "resistance line of the bullish symmetrical triangle".
The second line is a bullish trend line creating the support, also called the "support line of the bullish symmetrical triangle".
For the symmetrical triangle to be called "bullish", the movement preceding the triangle’s formation must be bullish.
A bullish symmetrical triangle is confirmed/valid if it has good oscillation between the two lines.
Each of these lines must have been touched at least twice to validate the pattern.
NB: a line is said to be "valid" if the price line touches the support or resistance at least 3 times.
This implies that the bullish symmetrical triangle is considered valid if the price touches the support line at least 3 times and the resistance line twice (or the support line at least twice and the resistance line 3 times).
The price objective for a bullish symmetrical triangle is determined by the height of the base of the triangle plotted at the breakout point (exit from the triangle). To achieve the price objective, another technique consists in drawing a parallel to the bullish symmetrical triangle’s support line from the first contact with the resistance line.
- In 63% of cases, exit from a bullish symmetrical triangle is bullish.
- In 89% of cases, the upward movement continues after exiting the triangle.
- In 81% of cases, the price manages to reach the triangle's price objective in the event of an upward exit.
- In 60% of cases, the price makes a pullback in support on the triangle’s resistance line.
- In 16% of cases, the price makes false breaks in the support/resistance lines (false exits from the bullish symmetrical triangle).
- A bullish symmetrical triangle’s exit most often occurs at about 80% of the pattern.
- Clean and forceful breaks/exits give better performance.
- Performance is best when the bullish symmetrical triangle is formed at the beginning of a bullish trend.
- Avoid opening a position if the break/exit occurs before 3/4 of the triangle.
- Support pullbacks on the triangle’s resistance line are detrimental to performance.
For your information: A bullish symmetrical triangle is a continuation chart pattern. Its opposite is a bearish symmetrical triangle.
What is a bullish symmetrical triangle?
A bullish symmetrical triangle is a bullish continuation chart pattern. The pattern is formed by two converging trend lines that are symmetrical in relation to the horizontal line.
The first line is a bearish trend line creating the resistance, also called the "resistance line of the bullish symmetrical triangle".
The second line is a bullish trend line creating the support, also called the "support line of the bullish symmetrical triangle".
For the symmetrical triangle to be called "bullish", the movement preceding the triangle’s formation must be bullish.
A bullish symmetrical triangle is confirmed/valid if it has good oscillation between the two lines.
Each of these lines must have been touched at least twice to validate the pattern.
NB: a line is said to be "valid" if the price line touches the support or resistance at least 3 times.
This implies that the bullish symmetrical triangle is considered valid if the price touches the support line at least 3 times and the resistance line twice (or the support line at least twice and the resistance line 3 times).
The price objective for a bullish symmetrical triangle is determined by the height of the base of the triangle plotted at the breakout point (exit from the triangle). To achieve the price objective, another technique consists in drawing a parallel to the bullish symmetrical triangle’s support line from the first contact with the resistance line.
Graphical representation of a bullish symmetrical triangle
Statistics of bullish symmetrical triangle
- In 63% of cases, exit from a bullish symmetrical triangle is bullish.
- In 89% of cases, the upward movement continues after exiting the triangle.
- In 81% of cases, the price manages to reach the triangle's price objective in the event of an upward exit.
- In 60% of cases, the price makes a pullback in support on the triangle’s resistance line.
- In 16% of cases, the price makes false breaks in the support/resistance lines (false exits from the bullish symmetrical triangle).
Notes on bullish symmetrical triangle
- A bullish symmetrical triangle’s exit most often occurs at about 80% of the pattern.
- Clean and forceful breaks/exits give better performance.
- Performance is best when the bullish symmetrical triangle is formed at the beginning of a bullish trend.
- Avoid opening a position if the break/exit occurs before 3/4 of the triangle.
- Support pullbacks on the triangle’s resistance line are detrimental to performance.
For your information: A bullish symmetrical triangle is a continuation chart pattern. Its opposite is a bearish symmetrical triangle.


