Chart pattern: rising wedge
-
- 1
- Who voted?
- 13776
- 0
What is a rising wedge?
A rising wedge is a bearish chart pattern (said to be "of reversal"). It is formed by two converging bullish lines.
A rising wedge is confirmed/valid if it has good oscillation between the two bullish lines. The upper line is the resistance line; the lower line is the support line.
Each of these lines must have been touched at least twice to validate the pattern.
NB: a line is said to be "valid" if the price line touches the support or resistance at least 3 times.
This implies that the rising wedge pattern is considered valid if the price touches the support line at least 3 times and the resistance line twice (or the support line at least twice and the resistance line 3 times).
A rising wedge marks the exhaustion of the buying trend. The convergence of the two lines in the same direction (a decrease in price magnitude) tells us that prices continue to rise with lower and lower movement magnitude. Buyers find it increasingly difficult to get the price to rise above the support line. The lowest point reached during the first correction on the rising wedge’s support line forms the support. A second wave of increases then occurs, but of a lesser magnitude, signalling an inadequacy of buyers. A third wave is then formed but the prices increase less and less in contact with the support. Volumes are then at their lowest point and decrease as the waves increase. The movement then has almost no buying power, which leads to a bearishreversal.
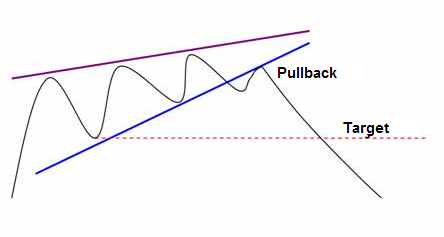
A break of the support line definitively validates the pattern. This break out is generally accompanied by high volumes. The price objective is determined by the lowest point that caused the wedge to form.
NB: it is often observed that the steeper the rising wedge’s trend lines, the faster the price objective is reached.
Graphical representation of a rising wedge
Rising wedge statistics
- In 82% of cases, the exit is bearish.
- In 55% of cases, a rising wedge is a reversal pattern.
- In 63% of cases, the pattern’s price objective is achieved when the support line is broken.
- In 53% of cases, the price makes a resistance pullback on the rising wedge’s support line.
- In 27% of cases, false breaks (false exits) appear.
Notes on rising wedges
- The contact points on the rising lines must be significant because otherwise it might be a flag.
- The steeper the rising wedge’s trend lines (rising strongly), the more severe the downward movement is at the breakout (exit from the chart pattern).
- False breaks (or false exits) give an indication of the direction of exit. If a false bearish break occurs, the exit will be upwards in only 3% of cases. Exploiting a false bearish break is therefore statistically low risk.
- Retracements are generally twice as fast as the rising wedge was in its formation.
- Pullbacks are detrimental to the pattern’s performance.
- The break out point (exit) generally occurs at 60% of the length of the rising wedge.
- Very wide rising wedges give better performance than narrow rising wedges.
For your information: A rising wedge is a reversal chart pattern. Its opposite is a falling wedge.


