Chart pattern: Descending broadening wedge
-
- 1
- Who voted?
- 53580
- 2
What is a descending broadening wedge?
A descending broadening wedge is bullish chart pattern (said to be a reversal pattern). It is formed by two diverging bullish lines.
A descending broadening wedge is confirmed/valid if it has good oscillation between the two upward lines . The upper line is the resistance line; the lower line is the support line.
Each of these lines must have been touched at least twice to validate the pattern.
NB: a line is said to be "valid" if the price line touches the support or resistance at least 3 times.
This implies that the descending broadening wedge pattern is considered valid if the price touches the support line at least 3 times and the resistance line twice (or the support line at least twice and the resistance line 3 times).
A descending broadening wedge does not mark the exhaustion of the selling current, but the buyers’ ambition to take control. The divergence of the two lines in the same direction (increase in price magnitude) informs us that the price continues to fall with movements that are increasingly low in magnitude. The sellers manage to make the price rebound on the resistance line but lose control after the formation of a new lowest point. The highest point reached during the first correction on the descending broadening wedge’s resistance line forms the resistance. A second wave of decline then occurs of more magnitude, signalling the sellers' loss of control after a new lowest point. A third wave forms afterwards but the sellers lose control again after the formation of new lowest points.
During the formation of a descending broadening wedge, volumes do not behave in any particular way but they increase strongly when the support line breaks.
CASE 1: formation of a descending broadening wedge after a trough
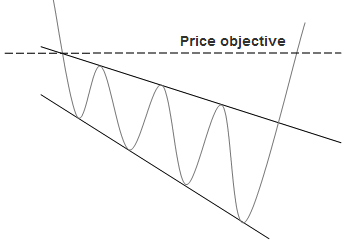
This type of pattern appears on the troughs, it is a bullish reversal pattern.
The break in the resistance line definitively validates the pattern.
The price objective is determined by the highest point at which the descending broadening wedge was formed.
NB: often, the steeper the descending broadening wedge’s trend lines, the faster the price objective is reached.
Statistics of the descending broadening wedge after a bullish movement
In 80% of cases, the exit is bullish.
In 75% of cases, a descending broadening wedge is a reversal pattern.
In 60% of cases, a descending broadening wedge’s price objective is achieved when the resistance line is broken.
In 21% of cases, the price makes a pullback in support on the descending broadening wedge’s resistance line.
CASE 2: formation of a descending broadening wedge after a peak
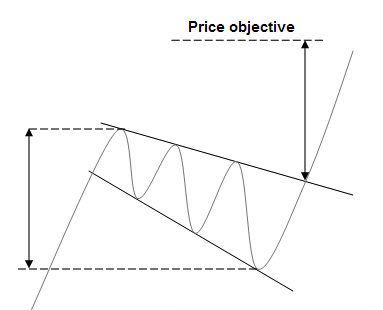
This type of pattern appears during the correction in a bullish movement, it is a bullish continuation pattern. Resumption of the bullish movement after correction.
The break in the resistance line definitively validates the pattern.
The price objective is given by plotting the wedge’s maximum height onto the breaking point
NB: pullbacks are harmful to the pattern’s performance.
Statistics of the descending broadening wedge after a bullish movement
- In 79% of cases, the exit is bullish.
- In 23% of cases, a descending broadening wedge occurs in a consolidation movement.
- In 81% of cases, the pattern's price objective is achieved when the resistance line is broken.
- In 40% of cases, the price makes a pullback in support on the descending broadening wedge’s resistance line.
For your information: A descending broadening wedge is a reversal chart pattern. Its opposite is an ascending broadening wedge.


