Chart pattern: Rounding bottom
-
- 0
- 5503
- 0
What is a rounding bottom?
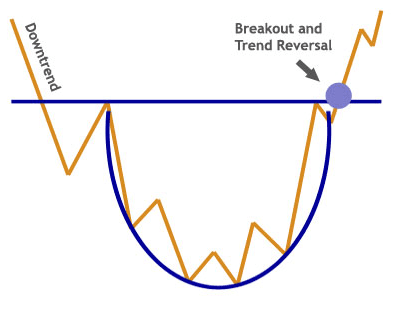
A rounding bottom is a U-shaped trough, also called a "saucer". The trough is very rounded with a flat bottom. However, in many cases, there are be several bearish peaks, but they do not call into question the pattern’s validity.
The pattern’s neck line is formed by the high point preceding the U’s formation.
There is no theoretical price objective. Some authors measure the depth of the U and plot it on the neck line as it happens, on a double bottom for example. However, it is not advisable to apply this technique, as the target is only reached in 36% of cases. The recommended theoretical objective is therefore to measure the depth of the U and divide it by 2 and then plot this height on the neck line.
The rounding bottom has long been considered as a reversal pattern. However, Bulkowski's work has shown that in many cases, the rounding bottom is a continuation pattern. On the other hand, when the neck line is broken, the results are very good.
Graphical representation of a rounding bottom
Statistics on rounding bottoms
Here are some statistics about rounding bottoms:
In 62% of cases, there is a bullish reversal
In 86% of cases, there is a bullish exit
In 95% of cases, the bullish movement continues after the bullish break in the neck line
In 40% of cases, a pullback intervenes on the neck line
In 57% of cases, the recommended objective is achieved
Notes on rounding bottoms
- The price often pauses when it returns to the neck line
- The flatter the trough, the more forceful the movement at the break in the neck line
- In case of pullback on the neck line after the break, the upward movement will be less forceful
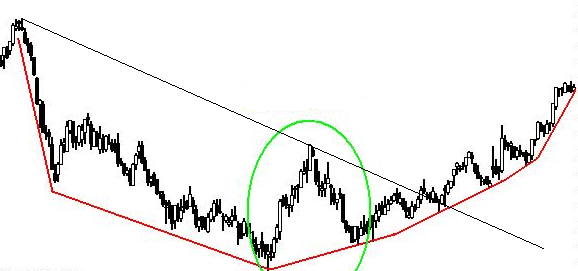
- If a large bullish peak occurs after the trough has formed, it is possible to draw a bearish line to connect the high point that preceded the formation of the rounding bottom and the high point of the bullish peak.
Trading strategies with rounding bottoms
The traditional strategy:
Entry: Open a long position at the break of the neck line
Stop loss: The stop loss is placed below the neck line
Objective: Theoretical objective of the pattern
Advantage: Many lowest points form during the price rise, so it is easy to place your stop loss.
Disadvantage: Because an accumulation zone often forms below the neck line, the break can be abrupt and therefore a large part of the movement is lost until the break is confirmed.
The aggressive strategy:
Entry: Open a long position after the break of a bearish slant in the pattern (see example above)
Stop loss: The stop loss is placed under the last lowest one
Objective: Return to the neck line
Advantage: The gain / risk ratio is high, the stop loss being placed close to the entry point
Disadvantage: The percentage loss of the trade is higher because the rounding bottom is not yet confirmed.
For your information: A Rounding Bottom is a reversal chart pattern. Its opposite is a Rounding Top.


