Chart pattern: Broadening bottom
-
- 0
- 8564
- 0
What is a broadening bottom?
A broadening bottom is a bullish reversal pattern. The pattern is formed by two divergent lines which are horizontally symmetric. It is therefore a reverse symmetrical triangle. The oscillations between the two triangle terminals are therefore becoming increasingly large. Each line must be touched at least twice to be validated.
The broadening bottom reflects the growing nervousness of investors and also their indecision. If the chart pattern is not spotted quickly, the movements may appear totally random and thus trap many investors.
The formation of this pattern has to be preceded by a bearish movement. This pattern is often due to cheap purchases that will form the highest points. However, selling pressure remains strong and indecision dominates.
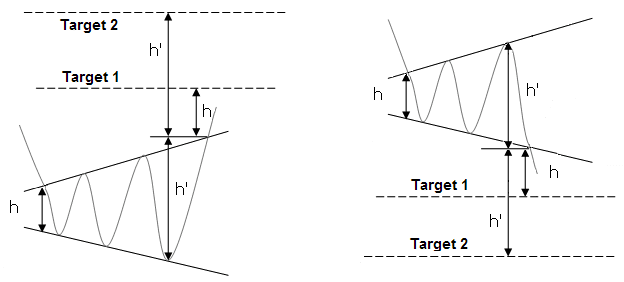
The price objective is given by plotting the top point of the triangle at its start where it breaks out. Another technique consists in plotting the maximum height of the triangle at the break out point.
Graphical representation of a broadening bottom
Broadening bottom statistics
Here are some statistics about broadening bottoms:
- In 58% of cases, there is a bullish exit
- In 60% of cases, the objective of the pattern is achieved by using the technique of the maximum height of the triangle. In the event of a bearish exit, the percentage increases to 70%.
- More than 78% of bearish exits occur when the price is in the lower third of its annual range.
Notes on broadening bottoms
- Pattern of indecision
- Bearish potential greater than bullish potential in the event of a break, which is rare in technical analysis
- From the 5th rotation (i.e. 5 contact points with either the resistance or the support), there is an 80% chance that the exit will occur at the next contact with the symmetrical triangle’s support or resistance lines. From the 6th rotation onwards, this percentage rises to 90%.
Trading strategies with broadening bottom
The traditional strategy:
Entry: Take a long position at the break in the resistance from the 5th or 6th rotation, if the price is in the upper third of its annual range.
Stop loss: The stop loss is placed under the resistance
Objective: Theoretical objective of the pattern
Advantage: High probability of trade success
Disadvantage: Bear breaks cause more movement than bullish breaks
Traditional strategy (2):
Entry: Take a short position at the break in the resistance from the 5th or 6th rotation, if the price is in the lower third of its annual range.
Stop loss: The stop loss is placed above the support
Objective: Theoretical objective of the pattern
Advantage: High probability of trade success
The aggressive strategy:
Entry: Take a long position in contact with the support and a short position in contact with the resistance
Stop loss: The stop is placed above/below the last lowest/highest point that has just been reached
Objective: Opposite terminal of the triangle
Advantage: There can be a large number of contact points (high rotation)
Disadvantage: The pattern is not easy to spot at first.
For your information: The broadening bottom is a reversal chart pattern. Its opposite pattern is an broadening top.


