How Is The S&P 500 Different From GDP?
-
- 0
- 3747
- 0
Highlights
- It is important to recognize that the S&P 500 is not GDP. S&P 500 companies have different drivers for earnings than the components that drive GDP.
- The backdrop of solid business spending within a slower trajectory of overall GDP growth can be a favorable one for the stock market.
- Although stocks are at the low end of our target 10–15% S&P 500 return range for 2014, we see further gains between now and year end as likely, with profit growth as a primary driver.
S&P Is Not GDP
U.S. economic growth has been subpar—right around 2%—during much of the ongoing economic expansion. Yet, the S&P 500 has returned nearly 230% cumulatively since the bear market low on March 9, 2009. How did that happen and is it justified?
Before trying to answer to those questions, it is worth pointing out that this situation is not all that unusual. In fact, since 1950, the S&P 500 median return is 13% (average is 12%) when real gross domestic product (GDP) grows less than 3%, with the S&P generating a positive return 68% of the time. However, a good portion of those returns come during recessions—historically, the best time to buy stocks is at recession troughs. But even if we take those periods in and around recessions out of the equation and look at annual returns when GDP growth is between 1–3%, the median (and average) S&P 500 return is a respectable 7–8%. Stocks tend to like average (or slightly below average) growth, which is not strong enough to generate worrisome inflation.
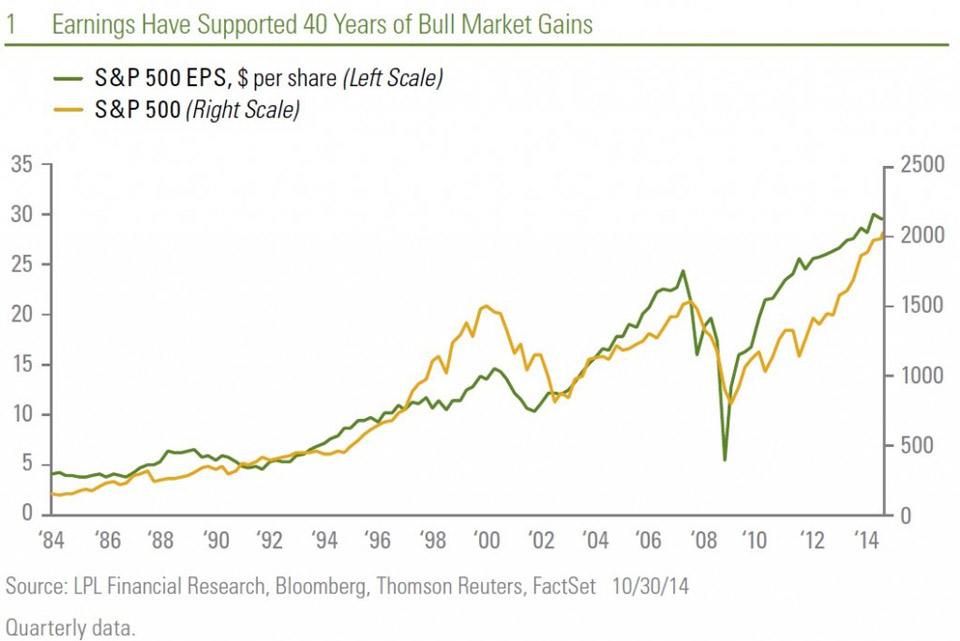
Now back to the question of what has driven this stock market to far outperform economic growth. Some might say quantitative easing (QE), which ended at the end of October 2014 in the United States (the Bank of Japan expanded its QE program last week on Halloween). While QE has benefitted U.S. stocks (how much is up for debate) by helping keep interest rates low and encouraging investors to buy riskier assets (see this week’s Weekly Economic Commentary for details), the bull market has been driven by much more than that. Increasing confidence in the economic recovery—albeit a slow one?—?and greater policy clarity in Washington have also been factors. But we think the best answer is earnings. In fact, over the past four decades, earnings have provided solid support for equity market gains [Figure 1].
But this commentary is not a deep dive into earnings (that’s coming soon). Instead, this week we highlight the differences between the S&P 500 and GDP, i.e., the U.S. economy, to shed some light on how corporate profits can grow so much faster than the economy, and bring stock prices right along with them.
How Is S&P Different from GDP?
S&P 500 companies have different drivers for earnings than the components that drive GDP. There are several key factors that differentiate the economic data from the earning power of corporate America that we think are important for investors to keep in mind:
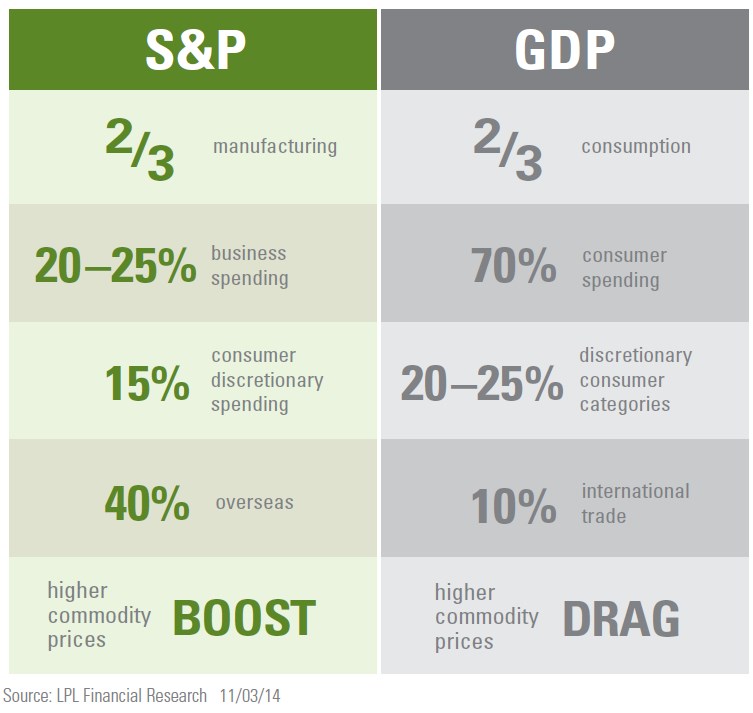
- Corporate profits are more manufacturing driven. Two-thirds of S&P 500 profits are from manufacturing, while two-thirds of U.S. consumption in GDP is services. The Institute for Supply Management (ISM) Manufacturing Survey has exceeded a solidly expansionary 55 level for five consecutive months, a positive signal for U.S. manufacturers. The recently released report on GDP for the third quarter of 2014 showed capital spending growth of 7% annualized, double the 3.5% growth rate of the overall U.S. economy. Many U.S. industrial and materials companies are benefiting from the U.S. energy renaissance that has brought greater access to cheaper energy sources and demand for infrastructure. The strength of the U.S manufacturing economy continues to support our positive industrials sector view.
- Corporate profits are less consumer driven. While 70% of GDP is consumer spending, only one-third of it is from discretionary categories, while an even lower 15% of S&P 500 profits come from consumer discretionary spending. A more significant portion of S&P 500 earnings?—?estimated 20–25%?—?comes from business spending. As we move into the latter half of the economic cycle, we expect a stronger contribution from the business spending side than consumer spending side, suggesting the S&P 500 is better positioned than GDP as 2014 comes to a close and we enter 2015. Still, we expect U.S. GDP to sustain a growth rate at or around 3% through year end and well into 2015.
- Corporate profits are more international trade driven. International trade only accounts for about 10% of GDP and acts as a drag on growth for most quarters because the United States imports more than it exports. Today, we estimate that 40% of S&P 500 profits are earned overseas?—?with about half of that from rapidly emerging market economies, including China. This makes S&P 500 earnings less dependent upon U.S. growth than 15–20 years ago, when roughly 20% of S&P profits were earned overseas, and 30 years ago when only a small portion of earnings were foreign sourced.
- Corporate profits are hurt much less by higher commodity prices than the S&P 500. In fact, higher commodity prices generally benefit S&P 500 companies because most of them either produce commodities (energy and materials), supply commodity producers with equipment (largely industrials), or are not heavy commodity users and are therefore not impacted much by higher commodity prices (technology, healthcare, financials, and telecommunications). U.S. corporations are increasingly benefiting from access to cheaper energy as the energy renaissance continues, although the pace of oil and gas production and the corresponding infrastructure build-out may slow and be a modest drag on S&P 500 earnings should oil prices fall much further. Our view is that oil stabilizes at or near $80 and begins to move higher; but lower oil prices are a risk for energy producers and equipment manufacturers.
Solid Business Spending with Slower GDP Growth Trajectory
We believe the backdrop of solid business spending within a slower trajectory of overall GDP growth can be a favorable one for the stock market. The economic data, while good recently, do not accurately reflect the earning power of corporate America, which remains quite strong. The S&P is not GDP?—?S&P 500 companies have different drivers for earnings than the components that drive GDP growth. Stocks are fundamentally driven by earnings, which have supported the gains during the current bull market and left valuations still within a reasonable range. The earnings picture still looks quite good today, with the S&P 500 on track for 9% year-over-year earnings growth in the third quarter, with about three quarters of the index constituents having reported.
Although stocks are at the low end of our target 10–15% S&P 500 return range for 2014, we see further gains between now and year end may be likely, with profit growth as a primary driver—with perhaps some help from the calendar, as midterm elections have historically been positive for stock returns.
by LPL Financial
- It is important to recognize that the S&P 500 is not GDP. S&P 500 companies have different drivers for earnings than the components that drive GDP.
- The backdrop of solid business spending within a slower trajectory of overall GDP growth can be a favorable one for the stock market.
- Although stocks are at the low end of our target 10–15% S&P 500 return range for 2014, we see further gains between now and year end as likely, with profit growth as a primary driver.
S&P Is Not GDP
U.S. economic growth has been subpar—right around 2%—during much of the ongoing economic expansion. Yet, the S&P 500 has returned nearly 230% cumulatively since the bear market low on March 9, 2009. How did that happen and is it justified?
Before trying to answer to those questions, it is worth pointing out that this situation is not all that unusual. In fact, since 1950, the S&P 500 median return is 13% (average is 12%) when real gross domestic product (GDP) grows less than 3%, with the S&P generating a positive return 68% of the time. However, a good portion of those returns come during recessions—historically, the best time to buy stocks is at recession troughs. But even if we take those periods in and around recessions out of the equation and look at annual returns when GDP growth is between 1–3%, the median (and average) S&P 500 return is a respectable 7–8%. Stocks tend to like average (or slightly below average) growth, which is not strong enough to generate worrisome inflation.
Now back to the question of what has driven this stock market to far outperform economic growth. Some might say quantitative easing (QE), which ended at the end of October 2014 in the United States (the Bank of Japan expanded its QE program last week on Halloween). While QE has benefitted U.S. stocks (how much is up for debate) by helping keep interest rates low and encouraging investors to buy riskier assets (see this week’s Weekly Economic Commentary for details), the bull market has been driven by much more than that. Increasing confidence in the economic recovery—albeit a slow one?—?and greater policy clarity in Washington have also been factors. But we think the best answer is earnings. In fact, over the past four decades, earnings have provided solid support for equity market gains [Figure 1].
But this commentary is not a deep dive into earnings (that’s coming soon). Instead, this week we highlight the differences between the S&P 500 and GDP, i.e., the U.S. economy, to shed some light on how corporate profits can grow so much faster than the economy, and bring stock prices right along with them.
How Is S&P Different from GDP?
S&P 500 companies have different drivers for earnings than the components that drive GDP. There are several key factors that differentiate the economic data from the earning power of corporate America that we think are important for investors to keep in mind:
- Corporate profits are more manufacturing driven. Two-thirds of S&P 500 profits are from manufacturing, while two-thirds of U.S. consumption in GDP is services. The Institute for Supply Management (ISM) Manufacturing Survey has exceeded a solidly expansionary 55 level for five consecutive months, a positive signal for U.S. manufacturers. The recently released report on GDP for the third quarter of 2014 showed capital spending growth of 7% annualized, double the 3.5% growth rate of the overall U.S. economy. Many U.S. industrial and materials companies are benefiting from the U.S. energy renaissance that has brought greater access to cheaper energy sources and demand for infrastructure. The strength of the U.S manufacturing economy continues to support our positive industrials sector view.
- Corporate profits are less consumer driven. While 70% of GDP is consumer spending, only one-third of it is from discretionary categories, while an even lower 15% of S&P 500 profits come from consumer discretionary spending. A more significant portion of S&P 500 earnings?—?estimated 20–25%?—?comes from business spending. As we move into the latter half of the economic cycle, we expect a stronger contribution from the business spending side than consumer spending side, suggesting the S&P 500 is better positioned than GDP as 2014 comes to a close and we enter 2015. Still, we expect U.S. GDP to sustain a growth rate at or around 3% through year end and well into 2015.
- Corporate profits are more international trade driven. International trade only accounts for about 10% of GDP and acts as a drag on growth for most quarters because the United States imports more than it exports. Today, we estimate that 40% of S&P 500 profits are earned overseas?—?with about half of that from rapidly emerging market economies, including China. This makes S&P 500 earnings less dependent upon U.S. growth than 15–20 years ago, when roughly 20% of S&P profits were earned overseas, and 30 years ago when only a small portion of earnings were foreign sourced.
- Corporate profits are hurt much less by higher commodity prices than the S&P 500. In fact, higher commodity prices generally benefit S&P 500 companies because most of them either produce commodities (energy and materials), supply commodity producers with equipment (largely industrials), or are not heavy commodity users and are therefore not impacted much by higher commodity prices (technology, healthcare, financials, and telecommunications). U.S. corporations are increasingly benefiting from access to cheaper energy as the energy renaissance continues, although the pace of oil and gas production and the corresponding infrastructure build-out may slow and be a modest drag on S&P 500 earnings should oil prices fall much further. Our view is that oil stabilizes at or near $80 and begins to move higher; but lower oil prices are a risk for energy producers and equipment manufacturers.
Solid Business Spending with Slower GDP Growth Trajectory
We believe the backdrop of solid business spending within a slower trajectory of overall GDP growth can be a favorable one for the stock market. The economic data, while good recently, do not accurately reflect the earning power of corporate America, which remains quite strong. The S&P is not GDP?—?S&P 500 companies have different drivers for earnings than the components that drive GDP growth. Stocks are fundamentally driven by earnings, which have supported the gains during the current bull market and left valuations still within a reasonable range. The earnings picture still looks quite good today, with the S&P 500 on track for 9% year-over-year earnings growth in the third quarter, with about three quarters of the index constituents having reported.
Although stocks are at the low end of our target 10–15% S&P 500 return range for 2014, we see further gains between now and year end may be likely, with profit growth as a primary driver—with perhaps some help from the calendar, as midterm elections have historically been positive for stock returns.
by LPL Financial


