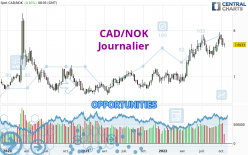
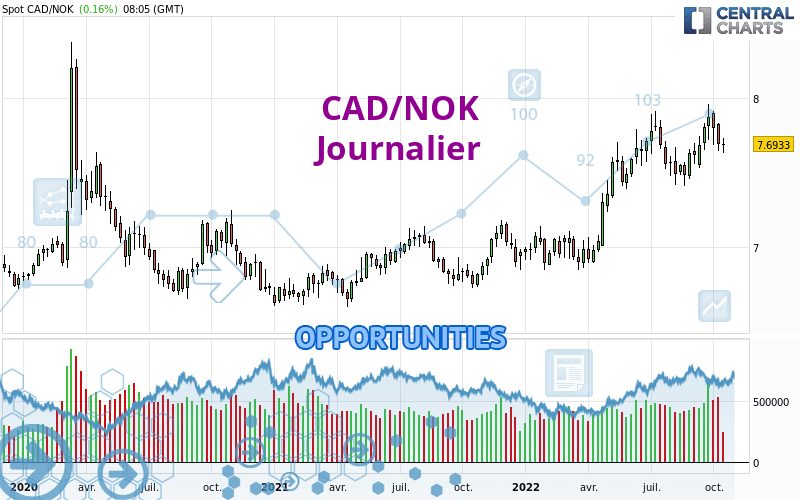
Londinia Opportunities Analyses - 06/18/2021 (GMT) CAD/NOK - Daily
I am delighted to see that my first price objective has been achieved. I hope you've taken advantage of it.
- FX/Indices
- Timeframe : Daily
- - Analysis generated on
- Status : TARGET REACHED
Summary of the analysis
Trends
Short term:
Bullish
Underlying:
Strongly bullish
Technical indicators
83%
6%
11%
My opinion
Bullish above 6.8783 NOK
My targets
6.9528 NOK (+0.0446)
7.0226 NOK (+0.1144)
My analysis
All elements being clearly bullish, it would be possible for traders to trade only long positions (at the time of purchase) on CAD/NOK as long as the price remains well above 6.8783 NOK. The buyers' bullish objective is set at 6.9528 NOK. A bullish break in this resistance would boost the bullish momentum. The buyers could then target the resistance located at 7.0226 NOK. If there is any crossing, the next objective would be the resistance located at 7.1576 NOK. Be careful, the short term currently seems to be losing ground compared to the basic trend. Longer time units should be analysed to identify possible overbought items that could be a sign of a possible short-term correction.
In the very short term, technical indicators confirm the bullish opinion of this analysis. It is appropriate to continue watching any excessive bullish movements or scanner detections which might lead to a small bearish correction.
Force
0
10
7.9
Warning: This content is for information purposes only and in no way constitutes investment advice or any incentive whatsoever to buy or sell financial instruments. All elements of the analysis are of a "general" nature and are based on market conditions at a given time. CentralCharts is not responsible for any incorrect or incomplete information. Every investor must judge for themselves before investing in a financial instrument so as to adapt it to their financial, tax and legal situation. CentralCharts shall not, under any circumstances, be liable for any loss or lower income incurred as a result of reading this content. Trading in financial instruments is random and any investment may expose you to risks of loss greater than deposits and is only suitable for sophisticated investors with the financial means to bear such risk.
Additional analysis
Quotes
The CAD/NOK price is 6.9082 NOK. On the day, this instrument lost -0.17% and was between 6.9039 NOK and 6.9229 NOK. This implies that the price is at +0.06% from its lowest and at -0.21% from its highest.6.9039
6.9229
6.9082
A bullish opening was detected by the Central Gaps scanner. Buyers are trying to impose a bullish momentum in the very short term.
Bullish opening
Type : Bullish
Timeframe : Openning
So that you have an overall view of the price change, here is a table showing the variations over several periods:
Technical
A technical analysis in Journalier of this CAD/NOK chart shows a strongly bullish trend. 89.29% of the signals given by moving averages are bullish. The slightly bullish signals given by the short-term moving averages indicate this trend is showing signs of running out of steam. There is no crossing of moving average by the price or crossing of moving averages between themselves.
In fact, according to the parameters integrated into the Central Analyzer system, 15 technical indicators out of 18 analysed are currently bullish. Other results related to technical indicators were also found by the Central Indicators scanner:
Pivot points : price is over resistance 1
Type : Neutral
Timeframe : Weekly
Ichimoku - Bullish crossover : Tenkan & Kijun
Type : Bullish
Timeframe : Daily
Price is back over the pivot point
Type : Bullish
Timeframe : Daily
No signals are given by Central Patterns, a market scanner specialised in chart patterns, resistances and supports.
The Central Candlesticks scanner which studies Japanese candlesticks did not detect anything.
ProTrendLines
S3
S2
S1
R1
R2
R3
Price
| S3 | S2 | S1 | Price | R1 | R2 | R3 | |
|---|---|---|---|---|---|---|---|
| ProTrendLines | 6.6872 | 6.8041 | 6.8783 | 6.9082 | 6.9528 | 7.0226 | 7.1576 |
| Change (%) | -3.20% | -1.51% | -0.43% | - | +0.65% | +1.66% | +3.61% |
| Change | -0.2210 | -0.1041 | -0.0299 | - | +0.0446 | +0.1144 | +0.2494 |
| Level | Minor | Minor | Intermediate | - | Major | Minor | Minor |
Attention could also be paid to pivot points to set price objectives:
Daily
| Pivot points | S3 | S2 | S1 | PP | R1 | R2 | R3 |
|---|---|---|---|---|---|---|---|
| Standard | 6.8175 | 6.8483 | 6.8841 | 6.9149 | 6.9507 | 6.9815 | 7.0173 |
| Camarilla | 6.9017 | 6.9078 | 6.9139 | 6.9200 | 6.9261 | 6.9322 | 6.9383 |
| Woodie | 6.8201 | 6.8496 | 6.8867 | 6.9162 | 6.9533 | 6.9828 | 7.0199 |
| Fibonacci | 6.8483 | 6.8737 | 6.8894 | 6.9149 | 6.9403 | 6.9560 | 6.9815 |
Weekly
| Pivot points | S3 | S2 | S1 | PP | R1 | R2 | R3 |
|---|---|---|---|---|---|---|---|
| Standard | 6.7397 | 6.7774 | 6.8192 | 6.8569 | 6.8987 | 6.9364 | 6.9782 |
| Camarilla | 6.8390 | 6.8463 | 6.8536 | 6.8609 | 6.8682 | 6.8755 | 6.8828 |
| Woodie | 6.7417 | 6.7784 | 6.8212 | 6.8579 | 6.9007 | 6.9374 | 6.9802 |
| Fibonacci | 6.7774 | 6.8078 | 6.8266 | 6.8569 | 6.8873 | 6.9061 | 6.9364 |
Monthly
| Pivot points | S3 | S2 | S1 | PP | R1 | R2 | R3 |
|---|---|---|---|---|---|---|---|
| Standard | 6.5349 | 6.6369 | 6.7631 | 6.8651 | 6.9913 | 7.0933 | 7.2195 |
| Camarilla | 6.8267 | 6.8476 | 6.8685 | 6.8894 | 6.9103 | 6.9312 | 6.9522 |
| Woodie | 6.5471 | 6.6430 | 6.7753 | 6.8712 | 7.0035 | 7.0994 | 7.2317 |
| Fibonacci | 6.6369 | 6.7240 | 6.7779 | 6.8651 | 6.9522 | 7.0061 | 7.0933 |
Numerical data
The following are the details of the technical indicators and moving averages that were collected to generate this technical analysis:
Technical indicators
Moving averages
| RSI (14): | 58.26 | |
| MACD (12,26,9): | 0.0159 | |
| Directional Movement: | 11.4369 | |
| AROON (14): | -42.8571 | |
| DEMA (21): | 6.8923 | |
| Parabolic SAR (0,02-0,02-0,2): | 6.9456 | |
| Elder Ray (13): | 0.0380 | |
| Super Trend (3,10): | 6.7518 | |
| Zig ZAG (10): | 6.9131 | |
| VORTEX (21): | 1.0602 | |
| Stochastique (14,3,5): | 72.26 | |
| TEMA (21): | 6.8857 | |
| Williams %R (14): | -24.69 | |
| Chande Momentum Oscillator (20): | 0.0194 | |
| Repulse (5,40,3): | 0.4360 | |
| ROCnROLL: | 1 | |
| TRIX (15,9): | 0.0351 | |
| Courbe Coppock: | 0.86 |
| MA7: | 6.8721 | |
| MA20: | 6.8809 | |
| MA50: | 6.8079 | |
| MA100: | 6.7755 | |
| MAexp7: | 6.8838 | |
| MAexp20: | 6.8697 | |
| MAexp50: | 6.8336 | |
| MAexp100: | 6.8107 | |
| Price / MA7: | +0.53% | |
| Price / MA20: | +0.40% | |
| Price / MA50: | +1.47% | |
| Price / MA100: | +1.96% | |
| Price / MAexp7: | +0.35% | |
| Price / MAexp20: | +0.56% | |
| Price / MAexp50: | +1.09% | |
| Price / MAexp100: | +1.43% |
Quotes :
-
Real time data
-
Forex