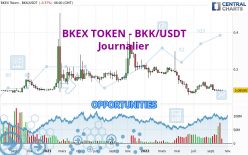
Londinia Opportunities Analyses - 09/16/2021 (GMT) BKEX TOKEN - BKK/USDT - Daily
| Type: | Cryptocurrencies |
| Ticker: | BKKUSDT |
| ISIN: |
I am delighted to see that my first price objective has been achieved. I hope you've taken advantage of it.
- Cryptocurrencies
- Timeframe : Daily
- - Analysis generated on
- Status : TARGET REACHED
Summary of the analysis
Trends
Short term:
Bullish
Underlying:
Strongly bullish
Technical indicators
67%
11%
22%
My opinion
Bullish above 0.162511 USDT
My targets
0.181000 USDT (+6.85%)
0.196700 USDT (+16.12%)
My analysis
All elements being clearly bullish, it would be possible for traders to trade only long positions (at the time of purchase) on BKEX TOKEN - BKK/USDT as long as the price remains well above 0.162511 USDT. The buyers' bullish objective is set at 0.181000 USDT. A bullish break in this resistance would boost the bullish momentum. The buyers could then target the resistance located at 0.196700 USDT. If there is any crossing, the next objective would be the resistance located at 0.242000 USDT. Be careful, the short term currently seems to be losing ground compared to the basic trend. Longer time units should be analysed to identify possible overbought items that could be a sign of a possible short-term correction.
In the very short term, the general bullish sentiment is confirmed by technical indicators. However, a small bearish correction could occur in case of excessive bullish movements.
Force
0
10
7.1

Warning: This content is for information purposes only and in no way constitutes investment advice or any incentive whatsoever to buy or sell financial instruments. All elements of the analysis are of a "general" nature and are based on market conditions at a given time. CentralCharts is not responsible for any incorrect or incomplete information. Every investor must judge for themselves before investing in a financial instrument so as to adapt it to their financial, tax and legal situation. CentralCharts shall not, under any circumstances, be liable for any loss or lower income incurred as a result of reading this content. Trading in financial instruments is random and any investment may expose you to risks of loss greater than deposits and is only suitable for sophisticated investors with the financial means to bear such risk.
Additional analysis
Quotes
BKEX TOKEN - BKK/USDT rating 0.169400 USDT. The price is lower by -0.41% since the last closing and was traded between 0.168300 USDT and 0.184500 USDT over the period. The price is currently at +0.65% from its lowest and -8.18% from its highest.0.168300
0.184500
0.169400
The Central Gaps scanner detects a bullish opening marking the presence of buyers ahead of sellers at the opening but not sufficiently marked to allow the price to register a quotation gap.
Bullish opening
Type : Bullish
Timeframe : Openning
So that you have an overall view of the price change, here is a table showing the variations over several periods:
Near a new HIGH record (1 month)
Type : Bullish
Timeframe : Weekly
Technical
Technical analysis of BKEX TOKEN - BKK/USDT in Journalier shows a strongly overall bullish trend. The signals given by moving averages are 89.29% bullish. This strongly bullish trend seems to be running out of steam given the signals being given by short-term moving averages. The Central Indicators market scanner currently does not detect any result that concerns moving averages.
In fact, according to the parameters integrated into the Central Analyzer system, 12 technical indicators out of 18 analysed are currently bullish. Central Indicators, the detector scanner for these technical indicators recently detected a signal:
Price is back under the pivot point
Type : Bearish
Timeframe : Weekly
Central Patterns, the market scanner focusing on chart patterns, resistances and supports found these results:
Near resistance of channel
Type : Bearish
Timeframe : Daily
Near resistance of triangle
Type : Bearish
Timeframe : Daily
Horizontal resistance is broken
Type : Bullish
Timeframe : Daily
Central Candlesticks, the scanner specialised in Japanese candlesticks, detects this inversion signal that could impact the current short-term trend:
Doji
Type : Neutral
Timeframe : Daily
ProTrendLines
S3
S2
S1
R1
R2
R3
Price
| S3 | S2 | S1 | Price | R1 | R2 | R3 | |
|---|---|---|---|---|---|---|---|
| ProTrendLines | 0.130640 | 0.147421 | 0.162511 | 0.169400 | 0.181000 | 0.196700 | 0.242000 |
| Change (%) | -22.88% | -12.97% | -4.07% | - | +6.85% | +16.12% | +42.86% |
| Change | -0.038760 | -0.021979 | -0.006889 | - | +0.011600 | +0.027300 | +0.072600 |
| Level | Minor | Intermediate | Intermediate | - | Minor | Minor | Intermediate |
Attention could also be paid to pivot points to set price objectives:
Daily
| Pivot points | S3 | S2 | S1 | PP | R1 | R2 | R3 |
|---|---|---|---|---|---|---|---|
| Standard | 0.149700 | 0.155500 | 0.162800 | 0.168600 | 0.175900 | 0.181700 | 0.189000 |
| Camarilla | 0.166498 | 0.167698 | 0.168899 | 0.170100 | 0.171301 | 0.172502 | 0.173703 |
| Woodie | 0.150450 | 0.155875 | 0.163550 | 0.168975 | 0.176650 | 0.182075 | 0.189750 |
| Fibonacci | 0.155500 | 0.160504 | 0.163596 | 0.168600 | 0.173604 | 0.176696 | 0.181700 |
Weekly
| Pivot points | S3 | S2 | S1 | PP | R1 | R2 | R3 |
|---|---|---|---|---|---|---|---|
| Standard | 0.093667 | 0.119033 | 0.141167 | 0.166533 | 0.188667 | 0.214033 | 0.236167 |
| Camarilla | 0.150238 | 0.154592 | 0.158946 | 0.163300 | 0.167654 | 0.172008 | 0.176363 |
| Woodie | 0.092050 | 0.118225 | 0.139550 | 0.165725 | 0.187050 | 0.213225 | 0.234550 |
| Fibonacci | 0.119033 | 0.137178 | 0.148388 | 0.166533 | 0.184678 | 0.195888 | 0.214033 |
Monthly
| Pivot points | S3 | S2 | S1 | PP | R1 | R2 | R3 |
|---|---|---|---|---|---|---|---|
| Standard | 0.111233 | 0.129267 | 0.148733 | 0.166767 | 0.186233 | 0.204267 | 0.223733 |
| Camarilla | 0.157888 | 0.161325 | 0.164763 | 0.168200 | 0.171638 | 0.175075 | 0.178513 |
| Woodie | 0.111950 | 0.129625 | 0.149450 | 0.167125 | 0.186950 | 0.204625 | 0.224450 |
| Fibonacci | 0.129267 | 0.143592 | 0.152442 | 0.166767 | 0.181092 | 0.189942 | 0.204267 |
Numerical data
The following is the status of the technical indicators and moving averages at the time of publication of this technical analysis:
Technical indicators
Moving averages
| RSI (14): | 58.47 | |
| MACD (12,26,9): | 0.0001 | |
| Directional Movement: | 4.003126 | |
| AROON (14): | -21.428571 | |
| DEMA (21): | 0.166353 | |
| Parabolic SAR (0,02-0,02-0,2): | 0.184811 | |
| Elder Ray (13): | 0.010279 | |
| Super Trend (3,10): | 0.147642 | |
| Zig ZAG (10): | 0.170200 | |
| VORTEX (21): | 1.0129 | |
| Stochastique (14,3,5): | 54.32 | |
| TEMA (21): | 0.164589 | |
| Williams %R (14): | -44.42 | |
| Chande Momentum Oscillator (20): | -0.004000 | |
| Repulse (5,40,3): | -1.4785 | |
| ROCnROLL: | 1 | |
| TRIX (15,9): | -0.0763 | |
| Courbe Coppock: | 9.30 |
| MA7: | 0.165229 | |
| MA20: | 0.168260 | |
| MA50: | 0.166572 | |
| MA100: | 0.161660 | |
| MAexp7: | 0.166978 | |
| MAexp20: | 0.167360 | |
| MAexp50: | 0.166153 | |
| MAexp100: | 0.164119 | |
| Price / MA7: | +2.52% | |
| Price / MA20: | +0.68% | |
| Price / MA50: | +1.70% | |
| Price / MA100: | +4.79% | |
| Price / MAexp7: | +1.45% | |
| Price / MAexp20: | +1.22% | |
| Price / MAexp50: | +1.95% | |
| Price / MAexp100: | +3.22% |
Quotes :
-
Real time data
-
Cryptocompare