Londinia Opportunities Analyses - 09/22/2021 (GMT) HERC HOLDINGS INC. - Daily
- U.S. Stocks
- Timeframe : Daily
- - Analysis generated on
- Status : TARGET REACHED
Summary of the analysis
Additional analysis
Quotes
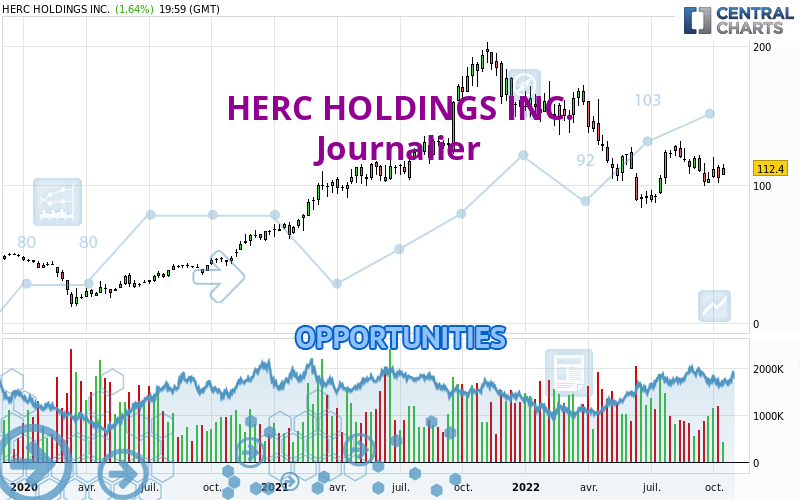
The HERC HOLDINGS INC. rating is 140.99 USD. The price has increased by +5.89% since the last closing and was between 136.47 USD and 140.99 USD. This implies that the price is at +3.31% from its lowest and at 0% from its highest.The Central Gaps scanner detects the formation of a bullish gap marking the strong presence of buyers against sellers at the opening. This formed a quotation gap.
Opening Gap UP
Type : Bullish
Timeframe : Openning
Here is a more detailed summary of the historical variations registered by HERC HOLDINGS INC.:
New HIGH record (5 years)
Type : Bullish
Timeframe : Weekly
New HIGH record (1 year)
Type : Bullish
Timeframe : Weekly
New HIGH record (1st january)
Type : Bullish
Timeframe : Weekly
New HIGH record (1 month)
Type : Bullish
Timeframe : Weekly
Technical
A technical analysis in Journalier of this HERC HOLDINGS INC. chart shows a strongly bullish trend. 92.86% of the signals given by moving averages are bullish. The overall trend is supported by the strong bullish signals from short-term moving averages. The Central Indicators market scanner is currently detecting a bullish signal that could impact this trend:
Bullish price crossover with Moving Average 20
Type : Bullish
Timeframe : Daily
Technical indicators are strongly bullish, suggesting that the price increase should continue.
Caution: the Central Indicators scanner currently detects an excess:
MACD indicator: bullish divergence
Type : Bullish
Timeframe : Daily
Williams %R indicator is overbought : over -20
Type : Neutral
Timeframe : Daily
Pivot points : price is over resistance 1
Type : Neutral
Timeframe : Weekly
Pivot points : price is over resistance 2
Type : Neutral
Timeframe : Daily
RSI indicator is back over 50
Type : Bullish
Timeframe : Daily
Parabolic SAR indicator bullish reversal
Type : Bullish
Timeframe : Daily
Momentum indicator is back over 0
Type : Bullish
Timeframe : Daily
Williams %R indicator is back over -50
Type : Bullish
Timeframe : Daily
An analysis of the price chart with the Central Patterns scanner (detector of chart patterns and resistances and supports) shows a result that can have an impact on the price change:
Near resistance of channel
Type : Bearish
Timeframe : Daily
No result was found by the Central Candlesticks scanner on Japanese candlesticks.
| S3 | S2 | S1 | Price | |
|---|---|---|---|---|
| ProTrendLines | 92.93 | 117.48 | 133.80 | 140.99 |
| Change (%) | -34.09% | -16.67% | -5.10% | - |
| Change | -48.06 | -23.51 | -7.19 | - |
| Level | Minor | Major | Major | - |
To determine price objectives, it is also possible to use the pivot points. Here is the price position in relation to pivot points:
| Pivot points | S3 | S2 | S1 | PP | R1 | R2 | R3 |
|---|---|---|---|---|---|---|---|
| Standard | 124.24 | 126.10 | 129.63 | 131.49 | 135.02 | 136.88 | 140.41 |
| Camarilla | 131.67 | 132.16 | 132.66 | 133.15 | 133.64 | 134.14 | 134.63 |
| Woodie | 125.07 | 126.52 | 130.46 | 131.91 | 135.85 | 137.30 | 141.24 |
| Fibonacci | 126.10 | 128.16 | 129.43 | 131.49 | 133.55 | 134.82 | 136.88 |
| Pivot points | S3 | S2 | S1 | PP | R1 | R2 | R3 |
|---|---|---|---|---|---|---|---|
| Standard | 111.68 | 116.95 | 122.93 | 128.20 | 134.18 | 139.45 | 145.43 |
| Camarilla | 125.82 | 126.85 | 127.88 | 128.91 | 129.94 | 130.97 | 132.00 |
| Woodie | 112.04 | 117.13 | 123.29 | 128.38 | 134.54 | 139.63 | 145.79 |
| Fibonacci | 116.95 | 121.25 | 123.90 | 128.20 | 132.50 | 135.15 | 139.45 |
| Pivot points | S3 | S2 | S1 | PP | R1 | R2 | R3 |
|---|---|---|---|---|---|---|---|
| Standard | 97.98 | 106.34 | 118.90 | 127.26 | 139.82 | 148.18 | 160.74 |
| Camarilla | 125.70 | 127.62 | 129.53 | 131.45 | 133.37 | 135.29 | 137.20 |
| Woodie | 100.07 | 107.39 | 120.99 | 128.31 | 141.91 | 149.23 | 162.83 |
| Fibonacci | 106.34 | 114.34 | 119.27 | 127.26 | 135.26 | 140.19 | 148.18 |
Numerical data
The following is the status of the technical indicators and moving averages at the time of publication of this technical analysis:
| RSI (14): | 63.37 | |
| MACD (12,26,9): | 1.9900 | |
| Directional Movement: | 15.41 | |
| AROON (14): | 14.29 | |
| DEMA (21): | 131.55 | |
| Parabolic SAR (0,02-0,02-0,2): | 122.00 | |
| Elder Ray (13): | 8.42 | |
| Super Trend (3,10): | 121.47 | |
| Zig ZAG (10): | 138.42 | |
| VORTEX (21): | 1.0300 | |
| Stochastique (14,3,5): | 70.49 | |
| TEMA (21): | 131.42 | |
| Williams %R (14): | -9.68 | |
| Chande Momentum Oscillator (20): | 8.20 | |
| Repulse (5,40,3): | 5.2900 | |
| ROCnROLL: | 1 | |
| TRIX (15,9): | 0.1800 | |
| Courbe Coppock: | 1.07 |
| MA7: | 129.75 | |
| MA20: | 129.56 | |
| MA50: | 124.60 | |
| MA100: | 116.93 | |
| MAexp7: | 131.66 | |
| MAexp20: | 129.05 | |
| MAexp50: | 124.57 | |
| MAexp100: | 116.55 | |
| Price / MA7: | +8.66% | |
| Price / MA20: | +8.82% | |
| Price / MA50: | +13.15% | |
| Price / MA100: | +20.58% | |
| Price / MAexp7: | +7.09% | |
| Price / MAexp20: | +9.25% | |
| Price / MAexp50: | +13.18% | |
| Price / MAexp100: | +20.97% |
News
The last news published on HERC HOLDINGS INC. at the time of the generation of this analysis was as follows:
- Herc Holdings Announces New Strategic Initiatives and Capital Allocation Plan
- Herc Holdings Announces Investor Day Weblink Registration Details
- Herc Holdings Announces Investor Day to be held on September 20, 2021
- Herc Holdings Completes Acquisition of Texas-based CBS Rentals
- Herc Holdings to Acquire Texas-based CBS Rentals