Londinia Opportunities Analyses - 01/21/2022 (GMT) CALLISTO NETWORK - CLO/USDT - Daily
| Type: | Cryptocurrencies |
| Ticker: | CLOUSDT |
| ISIN: |
I am delighted to see that my first price objective has been achieved. I hope you've taken advantage of it.
- Cryptocurrencies
- Timeframe : Daily
- - Analysis generated on
- Status : TARGET REACHED
Summary of the analysis
Trends
Short term:
Strongly bearish
Underlying:
Strongly bearish
Technical indicators
33%
44%
22%
My opinion
Bearish under 0.005466 USDT
My targets
0.004531 USDT (-12.37%)
0.004256 USDT (-17.69%)
My analysis
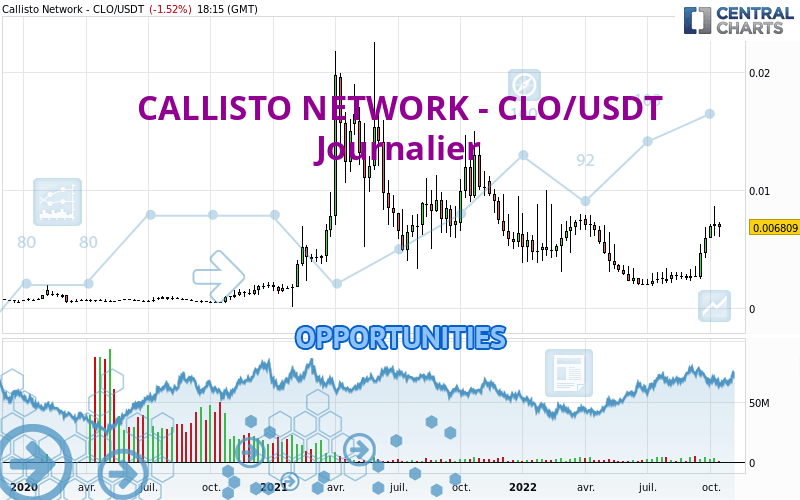
The bearish trend is currently very strong for CALLISTO NETWORK - CLO/USDT. As long as the price remains below the resistance at 0.005466 USDT, you could try to take advantage of the bearish rally. The first bearish objective is located at 0.004531 USDT. The bearish momentum would be revived by a break in this support. Sellers would then use the next support located at 0.004256 USDT as an objective. Crossing it would then enable sellers to target 0.001439 USDT. Be careful, given the powerful bearish rally underway, excesses could lead to a short-term rebound. If this is the case, remember that trading against the trend may be riskier. It would seem more appropriate to wait for a signal indicating reversal of the trend.
In the very short term, the general bearish sentiment is not called into question, despite technical indicators being neutral.
Force
0
10
6.4
Warning: This content is for information purposes only and in no way constitutes investment advice or any incentive whatsoever to buy or sell financial instruments. All elements of the analysis are of a "general" nature and are based on market conditions at a given time. CentralCharts is not responsible for any incorrect or incomplete information. Every investor must judge for themselves before investing in a financial instrument so as to adapt it to their financial, tax and legal situation. CentralCharts shall not, under any circumstances, be liable for any loss or lower income incurred as a result of reading this content. Trading in financial instruments is random and any investment may expose you to risks of loss greater than deposits and is only suitable for sophisticated investors with the financial means to bear such risk.
Additional analysis
Quotes
The CALLISTO NETWORK - CLO/USDT rating is 0.005171 USDT. On the day, this instrument gained +0.00% and was traded between 0.004105 USDT and 0.005500 USDT over the period. The price is currently at +25.97% from its lowest and -5.98% from its highest.0.004105
0.005500
0.005171
The Central Gaps scanner detects a bullish opening. A small advantage for buyers in the very short term.
Bullish opening
Type : Bullish
Timeframe : Openning
Here is a more detailed summary of the historical variations registered by CALLISTO NETWORK - CLO/USDT:
Technical
Technical analysis of CALLISTO NETWORK - CLO/USDT in Journalier shows a overall strongly bearish trend. The signals given by moving averages are 92.86% bearish. This strong bearish trend is confirmed by the strong signals currently being given by short-term moving averages. The Central Indicators market scanner currently does not detect any result that concerns moving averages.
An assessment of technical indicators does not currently provide any relevant information to suggest whether the signal given by the technical indicators is more bullish or bearish.
But beware of excesses. The Central Indicators scanner currently detects this:
CCI indicator is oversold : under -100
Type : Neutral
Timeframe : Daily
Pivot points : price is under support 1
Type : Neutral
Timeframe : Weekly
MACD crosses DOWN its Moving Average
Type : Bearish
Timeframe : Daily
Momentum indicator is back under 0
Type : Bearish
Timeframe : Daily
Williams %R indicator is back under -50
Type : Bearish
Timeframe : Daily
The analysis of the price chart with Central Patterns scanners does not return any result.
There is also a Japanese candlestick pattern detected by Central Candlesticks that could mark the end of the current short-term trend:
Doji
Type : Neutral
Timeframe : Daily
ProTrendLines
S2
S1
R1
R2
R3
Price
| S2 | S1 | Price | R1 | R2 | R3 | |
|---|---|---|---|---|---|---|
| ProTrendLines | 0.001439 | 0.004256 | 0.005171 | 0.006565 | 0.008439 | 0.010530 |
| Change (%) | -72.17% | -17.69% | - | +26.96% | +63.20% | +103.64% |
| Change | -0.003732 | -0.000915 | - | +0.001394 | +0.003268 | +0.005359 |
| Level | Minor | Major | - | Major | Minor | Intermediate |
Pivot points can also be used to set your price objectives. Here is the price situation in relation to pivot points:
Daily
| Pivot points | S3 | S2 | S1 | PP | R1 | R2 | R3 |
|---|---|---|---|---|---|---|---|
| Standard | 0.004072 | 0.004622 | 0.004896 | 0.005446 | 0.005720 | 0.006270 | 0.006544 |
| Camarilla | 0.004944 | 0.005020 | 0.005096 | 0.005171 | 0.005247 | 0.005322 | 0.005398 |
| Woodie | 0.003935 | 0.004553 | 0.004759 | 0.005377 | 0.005583 | 0.006201 | 0.006407 |
| Fibonacci | 0.004622 | 0.004936 | 0.005131 | 0.005446 | 0.005760 | 0.005955 | 0.006270 |
Weekly
| Pivot points | S3 | S2 | S1 | PP | R1 | R2 | R3 |
|---|---|---|---|---|---|---|---|
| Standard | 0.001978 | 0.002913 | 0.004531 | 0.005466 | 0.007084 | 0.008019 | 0.009637 |
| Camarilla | 0.005448 | 0.005682 | 0.005916 | 0.006150 | 0.006384 | 0.006618 | 0.006852 |
| Woodie | 0.002321 | 0.003084 | 0.004874 | 0.005637 | 0.007427 | 0.008190 | 0.009980 |
| Fibonacci | 0.002913 | 0.003888 | 0.004490 | 0.005466 | 0.006441 | 0.007043 | 0.008019 |
Monthly
| Pivot points | S3 | S2 | S1 | PP | R1 | R2 | R3 |
|---|---|---|---|---|---|---|---|
| Standard | -0.000394 | 0.002304 | 0.004256 | 0.006954 | 0.008906 | 0.011604 | 0.013556 |
| Camarilla | 0.004929 | 0.005356 | 0.005782 | 0.006208 | 0.006634 | 0.007061 | 0.007487 |
| Woodie | -0.000767 | 0.002118 | 0.003883 | 0.006768 | 0.008533 | 0.011418 | 0.013183 |
| Fibonacci | 0.002304 | 0.004080 | 0.005178 | 0.006954 | 0.008730 | 0.009828 | 0.011604 |
Numerical data
The following is the status of the technical indicators and moving averages at the time of publication of this technical analysis:
Technical indicators
Moving averages
| RSI (14): | 42.67 | |
| MACD (12,26,9): | -0.0003 | |
| Directional Movement: | -5.513093 | |
| AROON (14): | 57.142857 | |
| DEMA (21): | 0.005224 | |
| Parabolic SAR (0,02-0,02-0,2): | 0.006064 | |
| Elder Ray (13): | -0.000681 | |
| Super Trend (3,10): | 0.008603 | |
| Zig ZAG (10): | 0.005171 | |
| VORTEX (21): | 0.9346 | |
| Stochastique (14,3,5): | 52.54 | |
| TEMA (21): | 0.005355 | |
| Williams %R (14): | -48.14 | |
| Chande Momentum Oscillator (20): | -0.000016 | |
| Repulse (5,40,3): | 4.7351 | |
| ROCnROLL: | 2 | |
| TRIX (15,9): | -0.6152 | |
| Courbe Coppock: | 9.43 |
| MA7: | 0.005473 | |
| MA20: | 0.005582 | |
| MA50: | 0.006101 | |
| MA100: | 0.008414 | |
| MAexp7: | 0.005364 | |
| MAexp20: | 0.005595 | |
| MAexp50: | 0.006365 | |
| MAexp100: | 0.007364 | |
| Price / MA7: | -5.52% | |
| Price / MA20: | -7.36% | |
| Price / MA50: | -15.24% | |
| Price / MA100: | -38.54% | |
| Price / MAexp7: | -3.60% | |
| Price / MAexp20: | -7.58% | |
| Price / MAexp50: | -18.76% | |
| Price / MAexp100: | -29.78% |
Quotes :
-
Real time data
-
Cryptocompare