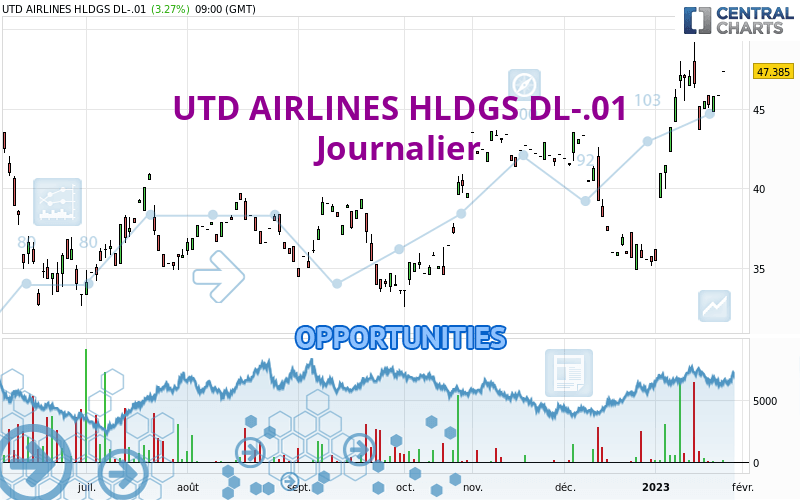
Londinia Opportunities Analyses - 01/26/2023 (GMT) UTD AIRLINES HLDGS DL-.01 - Daily
- Europe Stocks
- Timeframe : Daily
- - Analysis generated on
- Status : INVALID
Summary of the analysis
Trends
Short term:
Strongly bullish
Underlying:
Strongly bullish
Technical indicators
72%
0%
28%
My opinion
Bullish above 46.400 EUR
My targets
49.316 EUR (+4.08%)
53.500 EUR (+12.90%)
My analysis
The bullish trend is currently very strong on UTD AIRLINES HLDGS DL-.01. As long as the price remains above the support at 46.400 EUR, you could try to benefit from the boom. The first bullish objective is located at 49.316 EUR. The bullish momentum would be boosted by a break in this resistance. Buyers would then use the next resistance located at 53.500 EUR as an objective. Be careful, given the powerful bullish rally underway, excesses could lead to a possible correction in the short term. If this is the case, remember that trading against the trend may be riskier. It would seem more appropriate to wait for a signal indicating reversal of the trend.
Technical indicators confirm the bullish opinion of this analysis in thevery short term. However, be careful of excessive bullish movements. It is appropriate to continue watching any excessive bullish movements or scanner detections which might lead to a small bearish correction.
Force
0
10
8.4

Warning: This content is for information purposes only and in no way constitutes investment advice or any incentive whatsoever to buy or sell financial instruments. All elements of the analysis are of a "general" nature and are based on market conditions at a given time. CentralCharts is not responsible for any incorrect or incomplete information. Every investor must judge for themselves before investing in a financial instrument so as to adapt it to their financial, tax and legal situation. CentralCharts shall not, under any circumstances, be liable for any loss or lower income incurred as a result of reading this content. Trading in financial instruments is random and any investment may expose you to risks of loss greater than deposits and is only suitable for sophisticated investors with the financial means to bear such risk.
Additional analysis
Quotes
The UTD AIRLINES HLDGS DL-.01 price is 47.385 EUR. On the day, this instrument gained +3.27% and was traded between 47.385 EUR and 47.385 EUR over the period. The price is currently at 0% from its lowest and 0% from its highest.47.385
47.385
47.385
A bullish gap was detected at the opening by the Central Gaps scanner. There are a lot of buyers and they have the upper hand in the very short term.
Opening Gap UP
Type : Bullish
Timeframe : Openning
Here is a more detailed summary of the historical variations registered by UTD AIRLINES HLDGS DL-.01:
Technical
Technical analysis of this Journalier chart of UTD AIRLINES HLDGS DL-.01 indicates that the overall trend is strongly bullish. The signals given by the moving averages are 92.86% bullish. This strong bullish trend is confirmed by the strong signals currently being given by short-term moving averages. The Central Indicators market scanner currently does not detect any result that concerns moving averages.
The probability of a further increase is high given the direction of the technical indicators.
But beware of excesses. The Central Indicators scanner currently detects this:
Williams %R indicator is overbought : over -20
Type : Neutral
Timeframe : Daily
Pivot points : price is over resistance 3
Type : Neutral
Timeframe : Daily
No signals are given by Central Patterns, a market scanner specialised in chart patterns, resistances and supports.
The Central Candlesticks scanner currently notes the presence of this pattern in Japanese candlesticks that could mark the end of the short-term trend currently underway:
Doji
Type : Neutral
Timeframe : Daily
ProTrendLines
S3
S2
S1
R1
R2
Price
| S3 | S2 | S1 | Price | R1 | R2 | |
|---|---|---|---|---|---|---|
| ProTrendLines | 39.265 | 43.550 | 46.400 | 47.385 | 49.316 | 53.500 |
| Change (%) | -17.14% | -8.09% | -2.08% | - | +4.08% | +12.90% |
| Change | -8.120 | -3.835 | -0.985 | - | +1.931 | +6.115 |
| Level | Minor | Major | Intermediate | - | Major | Minor |
Attention could also be paid to pivot points to set price objectives:
Daily
| Pivot points | S3 | S2 | S1 | PP | R1 | R2 | R3 |
|---|---|---|---|---|---|---|---|
| Standard | 45.885 | 45.885 | 45.885 | 45.885 | 45.885 | 45.885 | 45.885 |
| Camarilla | 45.885 | 45.885 | 45.885 | 45.885 | 45.885 | 45.885 | 45.885 |
| Woodie | 45.885 | 45.885 | 45.885 | 45.885 | 45.885 | 45.885 | 45.885 |
| Fibonacci | 45.885 | 45.885 | 45.885 | 45.885 | 45.885 | 45.885 | 45.885 |
Weekly
| Pivot points | S3 | S2 | S1 | PP | R1 | R2 | R3 |
|---|---|---|---|---|---|---|---|
| Standard | 37.537 | 40.608 | 43.057 | 46.128 | 48.577 | 51.648 | 54.097 |
| Camarilla | 43.987 | 44.493 | 44.999 | 45.505 | 46.011 | 46.517 | 47.023 |
| Woodie | 37.225 | 40.453 | 42.745 | 45.973 | 48.265 | 51.493 | 53.785 |
| Fibonacci | 40.608 | 42.717 | 44.020 | 46.128 | 48.237 | 49.540 | 51.648 |
Monthly
| Pivot points | S3 | S2 | S1 | PP | R1 | R2 | R3 |
|---|---|---|---|---|---|---|---|
| Standard | 23.595 | 29.220 | 32.285 | 37.910 | 40.975 | 46.600 | 49.665 |
| Camarilla | 32.960 | 33.757 | 34.553 | 35.350 | 36.147 | 36.943 | 37.740 |
| Woodie | 22.315 | 28.580 | 31.005 | 37.270 | 39.695 | 45.960 | 48.385 |
| Fibonacci | 29.220 | 32.540 | 34.590 | 37.910 | 41.230 | 43.280 | 46.600 |
Numerical data
The following is the status of the technical indicators and moving averages at the time of publication of this technical analysis:
Technical indicators
Moving averages
| RSI (14): | 66.35 | |
| MACD (12,26,9): | 1.9070 | |
| Directional Movement: | 25.919 | |
| AROON (14): | 57.143 | |
| DEMA (21): | 45.913 | |
| Parabolic SAR (0,02-0,02-0,2): | 44.778 | |
| Elder Ray (13): | 2.641 | |
| Super Trend (3,10): | 42.817 | |
| Zig ZAG (10): | 47.385 | |
| VORTEX (21): | 1.0840 | |
| Stochastique (14,3,5): | 77.84 | |
| TEMA (21): | 47.265 | |
| Williams %R (14): | -18.52 | |
| Chande Momentum Oscillator (20): | 5.930 | |
| Repulse (5,40,3): | 0.3830 | |
| ROCnROLL: | 1 | |
| TRIX (15,9): | 0.5250 | |
| Courbe Coppock: | 47.98 |
| MA7: | 45.727 | |
| MA20: | 41.790 | |
| MA50: | 41.629 | |
| MA100: | 39.281 | |
| MAexp7: | 45.879 | |
| MAexp20: | 43.664 | |
| MAexp50: | 41.575 | |
| MAexp100: | 40.256 | |
| Price / MA7: | +3.63% | |
| Price / MA20: | +13.39% | |
| Price / MA50: | +13.83% | |
| Price / MA100: | +20.63% | |
| Price / MAexp7: | +3.28% | |
| Price / MAexp20: | +8.52% | |
| Price / MAexp50: | +13.97% | |
| Price / MAexp100: | +17.71% |
Quotes :
-
15 min delayed data
-
Actions Allemagne