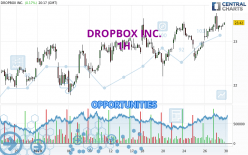
Londinia Opportunities Analyses - 01/27/2023 (GMT) DROPBOX INC. - 1H
- U.S. Stocks
- Timeframe : 1H
- - Analysis generated on
- Status : INVALID
Summary of the analysis
Trends
Short term:
Strongly bullish
Underlying:
Strongly bullish
Technical indicators
83%
0%
17%
My opinion
Bullish above 23.17 USD
My targets
23.70 USD (+1.20%)
24.84 USD (+6.06%)
My analysis
The bullish trend is currently very strong on DROPBOX INC.. As long as the price remains above the support at 23.17 USD, you could try to benefit from the boom. The first bullish objective is located at 23.70 USD. The bullish momentum would be boosted by a break in this resistance. Buyers would then use the next resistance located at 24.84 USD as an objective. Crossing it would then enable buyers to target 26.13 USD. Be careful, given the powerful bullish rally underway, excesses could lead to a possible correction in the short term. If this is the case, remember that trading against the trend may be riskier. It would seem more appropriate to wait for a signal indicating reversal of the trend.
Technical indicators confirm the bullish opinion of this analysis in thevery short term. However, be careful of excessive bullish movements. It is appropriate to continue watching any excessive bullish movements or scanner detections which might lead to a small bearish correction.
Force
0
10
8.8

Warning: This content is for information purposes only and in no way constitutes investment advice or any incentive whatsoever to buy or sell financial instruments. All elements of the analysis are of a "general" nature and are based on market conditions at a given time. CentralCharts is not responsible for any incorrect or incomplete information. Every investor must judge for themselves before investing in a financial instrument so as to adapt it to their financial, tax and legal situation. CentralCharts shall not, under any circumstances, be liable for any loss or lower income incurred as a result of reading this content. Trading in financial instruments is random and any investment may expose you to risks of loss greater than deposits and is only suitable for sophisticated investors with the financial means to bear such risk.
Additional analysis
Quotes
DROPBOX INC. rating 23.42 USD. The price registered an increase of +0.17% on the session and was between 23.22 USD and 23.64 USD. This implies that the price is at +0.86% from its lowest and at -0.93% from its highest.23.22
23.64
23.42
A bullish gap was detected at the opening by the Central Gaps scanner. There are a lot of buyers and they have the upper hand in the very short term.
Opening Gap UP
Type : Bullish
Timeframe : Openning
A study of price movements over other periods shows the following variations:
New HIGH record (1st january)
Type : Bullish
Timeframe : Weekly
New HIGH record (1 month)
Type : Bullish
Timeframe : Weekly
Technical
Technical analysis of this 1H chart of DROPBOX INC. indicates that the overall trend is strongly bullish. 92.86% of the signals given by moving averages are bullish. This strongly bullish trend is supported by the strong bullish signals given by short-term moving averages. The Central Indicators scanner does not detect any result on moving averages that would impact this trend.
Technical indicators are strongly bullish, suggesting that the price increase should continue.
No additional result has been identified by Central Indicators, the scanner specialised in technical indicators.
An analysis of the price chart with the Central Patterns scanner (detector of chart patterns and resistances and supports) shows a result that can have an impact on the price change:
Near horizontal support
Type : Bullish
Timeframe : 1 hour
No result was found by the Central Candlesticks scanner on Japanese candlesticks.
ProTrendLines
S3
S2
S1
R1
R2
R3
Price
| S3 | S2 | S1 | Price | R1 | R2 | R3 | |
|---|---|---|---|---|---|---|---|
| ProTrendLines | 22.94 | 23.17 | 23.34 | 23.42 | 23.52 | 23.70 | 24.84 |
| Change (%) | -2.05% | -1.07% | -0.34% | - | +0.43% | +1.20% | +6.06% |
| Change | -0.48 | -0.25 | -0.08 | - | +0.10 | +0.28 | +1.42 |
| Level | Intermediate | Intermediate | Minor | - | Intermediate | Major | Minor |
To determine price objectives, it is also possible to use the pivot points. Here is the price position in relation to pivot points:
Daily
| Pivot points | S3 | S2 | S1 | PP | R1 | R2 | R3 |
|---|---|---|---|---|---|---|---|
| Standard | 22.78 | 22.90 | 23.14 | 23.26 | 23.50 | 23.62 | 23.86 |
| Camarilla | 23.28 | 23.31 | 23.35 | 23.38 | 23.41 | 23.45 | 23.48 |
| Woodie | 22.84 | 22.93 | 23.20 | 23.29 | 23.56 | 23.65 | 23.92 |
| Fibonacci | 22.90 | 23.04 | 23.12 | 23.26 | 23.40 | 23.48 | 23.62 |
Weekly
| Pivot points | S3 | S2 | S1 | PP | R1 | R2 | R3 |
|---|---|---|---|---|---|---|---|
| Standard | 20.84 | 21.52 | 22.16 | 22.84 | 23.48 | 24.16 | 24.80 |
| Camarilla | 22.44 | 22.56 | 22.68 | 22.80 | 22.92 | 23.04 | 23.16 |
| Woodie | 20.82 | 21.51 | 22.14 | 22.83 | 23.46 | 24.15 | 24.78 |
| Fibonacci | 21.52 | 22.02 | 22.34 | 22.84 | 23.34 | 23.66 | 24.16 |
Monthly
| Pivot points | S3 | S2 | S1 | PP | R1 | R2 | R3 |
|---|---|---|---|---|---|---|---|
| Standard | 19.37 | 20.65 | 21.52 | 22.80 | 23.67 | 24.95 | 25.82 |
| Camarilla | 21.79 | 21.99 | 22.18 | 22.38 | 22.58 | 22.77 | 22.97 |
| Woodie | 19.16 | 20.55 | 21.31 | 22.70 | 23.46 | 24.85 | 25.61 |
| Fibonacci | 20.65 | 21.48 | 21.98 | 22.80 | 23.63 | 24.13 | 24.95 |
Numerical data
The following are the details of the technical indicators and moving averages that were collected to generate this technical analysis:
Technical indicators
Moving averages
| RSI (14): | 60.12 | |
| MACD (12,26,9): | 0.1100 | |
| Directional Movement: | 14.49 | |
| AROON (14): | 71.43 | |
| DEMA (21): | 23.36 | |
| Parabolic SAR (0,02-0,02-0,2): | 23.15 | |
| Elder Ray (13): | 0.09 | |
| Super Trend (3,10): | 22.89 | |
| Zig ZAG (10): | 23.38 | |
| VORTEX (21): | 1.0300 | |
| Stochastique (14,3,5): | 62.72 | |
| TEMA (21): | 23.40 | |
| Williams %R (14): | -35.42 | |
| Chande Momentum Oscillator (20): | 0.27 | |
| Repulse (5,40,3): | 0.3100 | |
| ROCnROLL: | 1 | |
| TRIX (15,9): | 0.0600 | |
| Courbe Coppock: | 3.96 |
| MA7: | 23.05 | |
| MA20: | 22.76 | |
| MA50: | 22.70 | |
| MA100: | 22.02 | |
| MAexp7: | 23.34 | |
| MAexp20: | 23.22 | |
| MAexp50: | 23.07 | |
| MAexp100: | 22.92 | |
| Price / MA7: | +1.61% | |
| Price / MA20: | +2.90% | |
| Price / MA50: | +3.17% | |
| Price / MA100: | +6.36% | |
| Price / MAexp7: | +0.34% | |
| Price / MAexp20: | +0.86% | |
| Price / MAexp50: | +1.52% | |
| Price / MAexp100: | +2.18% |
Quotes :
-
15 min delayed data
-
Actions NASDAQ
News
Don't forget to follow the news on DROPBOX INC.. At the time of publication of this analysis, the latest news was as follows:
- Dropbox: the smart workspace
- Dropbox Announces Fourth Quarter and Fiscal 2018 Results
- Dropbox Completes Acquisition of HelloSign