Londinia Opportunities Analyses - 02/01/2023 (GMT) SECUNET SECURITY AG O.N. - Daily
-
EUR
(-)
-
15 min delayed data - Germany Stocks
| Type: | Stocks |
| Ticker: | YSN |
| ISIN: | DE0007276503 |
I am delighted to see that my first price objective has been achieved. I hope you've taken advantage of it.
- Europe Stocks
- Timeframe : Daily
- - Analysis generated on
- Status : TARGET REACHED
Summary of the analysis
Trends
Short term:
Strongly bullish
Underlying:
Strongly bullish
Technical indicators
83%
0%
17%
My opinion
Bullish above 214.8 EUR
My targets
239.0 EUR (+7.42%)
265.8 EUR (+19.46%)
My analysis
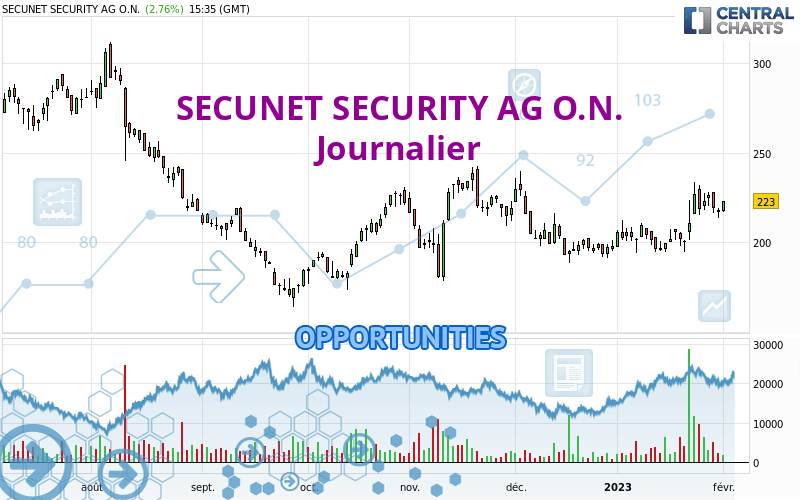
SECUNET SECURITY AG O.N. is part of a very strong bullish trend. Traders may consider trading only long positions (at the time of purchase) as long as the price remains well above 214.8 EUR. The next resistance located at 239.0 EUR is the next bullish objective to be reached. A bullish break in this resistance would boost the bullish momentum. The bullish movement could then continue towards the next resistance located at 265.8 EUR. After this resistance, buyers could then target 301.9 EUR. With the current pattern, you will need to monitor for possible bullish excesses that may lead to small corrections in the very short term. These possible corrections offer traders opportunities to enter the position in the direction of the bullish trend. Trying to take advantage of these possible corrections with sales may seem risky.
Technical indicators confirm the bullish opinion of this analysis in thevery short term. However, be careful of excessive bullish movements. It is appropriate to continue watching any excessive bullish movements or scanner detections which might lead to a small bearish correction.
Force
0
10
8

Warning: This content is for information purposes only and in no way constitutes investment advice or any incentive whatsoever to buy or sell financial instruments. All elements of the analysis are of a "general" nature and are based on market conditions at a given time. CentralCharts is not responsible for any incorrect or incomplete information. Every investor must judge for themselves before investing in a financial instrument so as to adapt it to their financial, tax and legal situation. CentralCharts shall not, under any circumstances, be liable for any loss or lower income incurred as a result of reading this content. Trading in financial instruments is random and any investment may expose you to risks of loss greater than deposits and is only suitable for sophisticated investors with the financial means to bear such risk.
Additional analysis
Quotes
The SECUNET SECURITY AG O.N. rating is 222.5 EUR. The price has increased by +2.54% since the last closing with the lowest point at 217.0 EUR and the highest point at 223.0 EUR. The deviation from the price is +2.53% for the low point and -0.22% for the high point.217.0
223.0
222.5
A bullish opening was detected by the Central Gaps scanner. Buyers are trying to impose a bullish momentum in the very short term.
Bullish opening
Type : Bullish
Timeframe : Openning
Here is a more detailed summary of the historical variations registered by SECUNET SECURITY AG O.N.:
Technical
Technical analysis of SECUNET SECURITY AG O.N. in Journalier shows a strongly overall bullish trend. 85.71% of the signals given by moving averages are bullish. The overall trend is supported by the strong bullish signals from short-term moving averages. The Central Indicators scanner does not detect any result on moving averages that would impact this trend.
The probability of a further increase is high given the direction of the technical indicators.
Central Indicators, the detector scanner for these technical indicators recently detected a signal:
Pivot points : price is over resistance 2
Type : Neutral
Timeframe : Daily
An analysis of the price chart with the Central Patterns scanner (detector of chart patterns and resistances and supports) shows several results that can have an impact on the price change:
Near resistance of triangle
Type : Bearish
Timeframe : Daily
Near horizontal support
Type : Bullish
Timeframe : Daily
The presence of a bullish Japanese candlestick pattern detected by Central Candlesticks that could cause a very short term rebound was also detected:
White morning star
Type : Bullish
Timeframe : Daily
ProTrendLines
S3
S2
S1
R1
R2
R3
Price
| S3 | S2 | S1 | Price | R1 | R2 | R3 | |
|---|---|---|---|---|---|---|---|
| ProTrendLines | 170.4 | 194.2 | 220.7 | 222.5 | 239.0 | 265.8 | 301.9 |
| Change (%) | -23.42% | -12.72% | -0.81% | - | +7.42% | +19.46% | +35.69% |
| Change | -52.1 | -28.3 | -1.8 | - | +16.5 | +43.3 | +79.4 |
| Level | Major | Major | Major | - | Minor | Minor | Intermediate |
Attention could also be paid to pivot points to set price objectives:
Daily
| Pivot points | S3 | S2 | S1 | PP | R1 | R2 | R3 |
|---|---|---|---|---|---|---|---|
| Standard | 208.5 | 211.0 | 214.0 | 216.5 | 219.5 | 222.0 | 225.0 |
| Camarilla | 215.5 | 216.0 | 216.5 | 217.0 | 217.5 | 218.0 | 218.5 |
| Woodie | 208.8 | 211.1 | 214.3 | 216.6 | 219.8 | 222.1 | 225.3 |
| Fibonacci | 211.0 | 213.1 | 214.4 | 216.5 | 218.6 | 219.9 | 222.0 |
Weekly
| Pivot points | S3 | S2 | S1 | PP | R1 | R2 | R3 |
|---|---|---|---|---|---|---|---|
| Standard | 175.5 | 188.5 | 207.5 | 220.5 | 239.5 | 252.5 | 271.5 |
| Camarilla | 217.7 | 220.6 | 223.6 | 226.5 | 229.4 | 232.4 | 235.3 |
| Woodie | 178.5 | 190.0 | 210.5 | 222.0 | 242.5 | 254.0 | 274.5 |
| Fibonacci | 188.5 | 200.7 | 208.3 | 220.5 | 232.7 | 240.3 | 252.5 |
Monthly
| Pivot points | S3 | S2 | S1 | PP | R1 | R2 | R3 |
|---|---|---|---|---|---|---|---|
| Standard | 156.3 | 175.1 | 196.0 | 214.8 | 235.7 | 254.5 | 275.4 |
| Camarilla | 206.1 | 209.7 | 213.4 | 217.0 | 220.6 | 224.3 | 227.9 |
| Woodie | 157.5 | 175.6 | 197.2 | 215.3 | 236.9 | 255.0 | 276.6 |
| Fibonacci | 175.1 | 190.2 | 199.6 | 214.8 | 229.9 | 239.3 | 254.5 |
Numerical data
The following are the details of the technical indicators and moving averages that were collected to generate this technical analysis:
Technical indicators
Moving averages
| RSI (14): | 58.60 | |
| MACD (12,26,9): | 4.9000 | |
| Directional Movement: | 11.7 | |
| AROON (14): | 57.1 | |
| DEMA (21): | 217.6 | |
| Parabolic SAR (0,02-0,02-0,2): | 203.2 | |
| Elder Ray (13): | 4.8 | |
| Super Trend (3,10): | 192.7 | |
| Zig ZAG (10): | 222.5 | |
| VORTEX (21): | 1.0000 | |
| Stochastique (14,3,5): | 64.00 | |
| TEMA (21): | 222.5 | |
| Williams %R (14): | -28.30 | |
| Chande Momentum Oscillator (20): | 22.9 | |
| Repulse (5,40,3): | 1.3000 | |
| ROCnROLL: | 1 | |
| TRIX (15,9): | 0.2000 | |
| Courbe Coppock: | 18.10 |
| MA7: | 221.9 | |
| MA20: | 209.4 | |
| MA50: | 207.8 | |
| MA100: | 204.6 | |
| MAexp7: | 218.9 | |
| MAexp20: | 212.3 | |
| MAexp50: | 209.5 | |
| MAexp100: | 218.0 | |
| Price / MA7: | +0.27% | |
| Price / MA20: | +6.26% | |
| Price / MA50: | +7.07% | |
| Price / MA100: | +8.75% | |
| Price / MAexp7: | +1.64% | |
| Price / MAexp20: | +4.80% | |
| Price / MAexp50: | +6.21% | |
| Price / MAexp100: | +2.06% |
Quotes :
-
15 min delayed data
-
Actions Allemagne
News
Don't forget to follow the news on SECUNET SECURITY AG O.N.. At the time of publication of this analysis, the latest news was as follows:
- EQS-News: secunet Security Networks AG closes 2022 with record revenues once again
- EQS-News: secunet Security Networks AG: secunet Security Networks AG publishes Group Quarterly Statement as at 30 September 2022 and confirms Forecast 2022
- DGAP-News: secunet Security Networks AG publishes Half-Year Financial Report 2022
- DGAP-News: secunet Security Networks AG: Annual General Meeting adopts all proposed resolutions with large majorities
- DGAP-News: secunet Security Networks AG acquires SysEleven GmbH