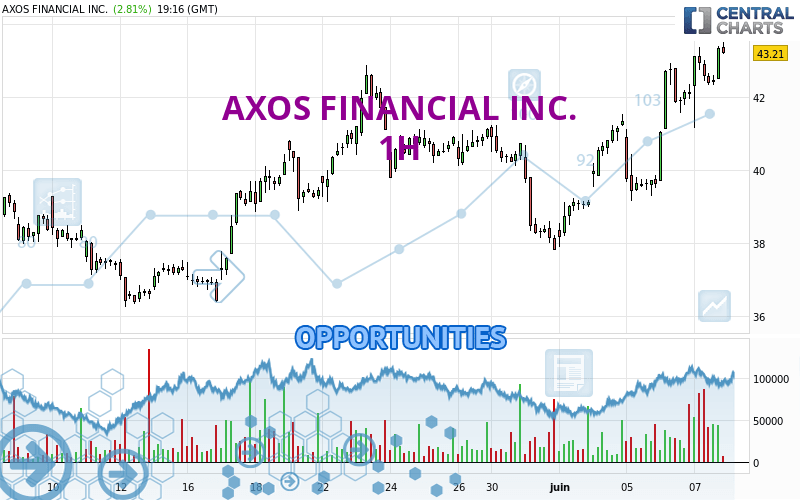
Londinia Opportunities Analyses - 06/07/2023 (GMT) AXOS FINANCIAL INC. - 1H
- U.S. Stocks
- Timeframe : 1H
- - Analysis generated on
- Status : INVALID
Summary of the analysis
Trends
Short term:
Strongly bullish
Underlying:
Strongly bullish
Technical indicators
72%
6%
22%
My opinion
Bullish above 42.61 USD
My targets
44.65 USD (+3.00%)
46.36 USD (+6.95%)
My analysis
The bullish trend is currently very strong on AXOS FINANCIAL INC.. As long as the price remains above the support at 42.61 USD, you could try to benefit from the boom. The first bullish objective is located at 44.65 USD. The bullish momentum would be boosted by a break in this resistance. Buyers would then use the next resistance located at 46.36 USD as an objective. Crossing it would then enable buyers to target 48.52 USD. Be careful, given the powerful bullish rally underway, excesses could lead to a possible correction in the short term. If this is the case, remember that trading against the trend may be riskier. It would seem more appropriate to wait for a signal indicating reversal of the trend.
In the very short term, the general bullish sentiment is confirmed by technical indicators. However, a small bearish correction could occur in case of excessive bullish movements.
Force
0
10
8.2

Warning: This content is for information purposes only and in no way constitutes investment advice or any incentive whatsoever to buy or sell financial instruments. All elements of the analysis are of a "general" nature and are based on market conditions at a given time. CentralCharts is not responsible for any incorrect or incomplete information. Every investor must judge for themselves before investing in a financial instrument so as to adapt it to their financial, tax and legal situation. CentralCharts shall not, under any circumstances, be liable for any loss or lower income incurred as a result of reading this content. Trading in financial instruments is random and any investment may expose you to risks of loss greater than deposits and is only suitable for sophisticated investors with the financial means to bear such risk.
Additional analysis
Quotes
AXOS FINANCIAL INC. rating 43.35 USD. On the day, this instrument gained +3.14% and was between 41.15 USD and 43.50 USD. This implies that the price is at +5.35% from its lowest and at -0.34% from its highest.41.15
43.50
43.35
A bullish opening was detected by the Central Gaps scanner. Buyers are trying to impose a bullish momentum in the very short term.
Bullish opening
Type : Bullish
Timeframe : Openning
So that you have an overall view of the price change, here is a table showing the variations over several periods:
New HIGH record (1 month)
Type : Bullish
Timeframe : Weekly
Technical
Technical analysis of AXOS FINANCIAL INC. in 1H shows a strongly overall bullish trend. 92.86% of the signals given by moving averages are bullish. The overall trend is supported by the strong bullish signals from short-term moving averages. The Central Indicators market scanner currently does not detect any result that concerns moving averages.
Technical indicators are strongly bullish, suggesting that the price increase should continue.
Caution: the Central Indicators scanner currently detects an excess:
Williams %R indicator is overbought : over -20
Type : Neutral
Timeframe : 1 hour
Pivot points : price is over resistance 1
Type : Neutral
Timeframe : Weekly
No signals are given by Central Patterns, a market scanner specialised in chart patterns, resistances and supports.
No result was found by the Central Candlesticks scanner on Japanese candlesticks.
ProTrendLines
S3
S2
S1
R1
R2
R3
Price
| S3 | S2 | S1 | Price | R1 | R2 | R3 | |
|---|---|---|---|---|---|---|---|
| ProTrendLines | 40.67 | 41.56 | 42.61 | 43.35 | 44.65 | 48.52 | 51.14 |
| Change (%) | -6.18% | -4.13% | -1.71% | - | +3.00% | +11.93% | +17.97% |
| Change | -2.68 | -1.79 | -0.74 | - | +1.30 | +5.17 | +7.79 |
| Level | Minor | Minor | Major | - | Major | Minor | Major |
To determine price objectives, it is also possible to use the pivot points. Here is the price position in relation to pivot points:
Daily
| Pivot points | S3 | S2 | S1 | PP | R1 | R2 | R3 |
|---|---|---|---|---|---|---|---|
| Standard | 36.94 | 38.32 | 40.17 | 41.55 | 43.40 | 44.78 | 46.63 |
| Camarilla | 41.14 | 41.44 | 41.73 | 42.03 | 42.33 | 42.62 | 42.92 |
| Woodie | 37.19 | 38.44 | 40.42 | 41.67 | 43.65 | 44.90 | 46.88 |
| Fibonacci | 38.32 | 39.55 | 40.31 | 41.55 | 42.78 | 43.54 | 44.78 |
Weekly
| Pivot points | S3 | S2 | S1 | PP | R1 | R2 | R3 |
|---|---|---|---|---|---|---|---|
| Standard | 35.20 | 36.51 | 38.92 | 40.23 | 42.64 | 43.95 | 46.36 |
| Camarilla | 40.32 | 40.66 | 41.00 | 41.34 | 41.68 | 42.02 | 42.36 |
| Woodie | 35.76 | 36.79 | 39.48 | 40.51 | 43.20 | 44.23 | 46.92 |
| Fibonacci | 36.51 | 37.93 | 38.81 | 40.23 | 41.65 | 42.53 | 43.95 |
Monthly
| Pivot points | S3 | S2 | S1 | PP | R1 | R2 | R3 |
|---|---|---|---|---|---|---|---|
| Standard | 27.81 | 31.83 | 34.82 | 38.84 | 41.83 | 45.85 | 48.84 |
| Camarilla | 35.89 | 36.54 | 37.18 | 37.82 | 38.46 | 39.11 | 39.75 |
| Woodie | 27.31 | 31.57 | 34.32 | 38.58 | 41.33 | 45.59 | 48.34 |
| Fibonacci | 31.83 | 34.50 | 36.16 | 38.84 | 41.51 | 43.17 | 45.85 |
Numerical data
The following is the status of the technical indicators and moving averages at the time of publication of this technical analysis:
Technical indicators
Moving averages
| RSI (14): | 66.54 | |
| MACD (12,26,9): | 0.7500 | |
| Directional Movement: | 8.71 | |
| AROON (14): | 71.43 | |
| DEMA (21): | 42.72 | |
| Parabolic SAR (0,02-0,02-0,2): | 41.03 | |
| Elder Ray (13): | 0.63 | |
| Super Trend (3,10): | 40.78 | |
| Zig ZAG (10): | 42.95 | |
| VORTEX (21): | 1.0900 | |
| Stochastique (14,3,5): | 82.54 | |
| TEMA (21): | 43.15 | |
| Williams %R (14): | -6.99 | |
| Chande Momentum Oscillator (20): | 2.07 | |
| Repulse (5,40,3): | 2.2700 | |
| ROCnROLL: | 1 | |
| TRIX (15,9): | 0.2400 | |
| Courbe Coppock: | 12.32 |
| MA7: | 40.56 | |
| MA20: | 39.69 | |
| MA50: | 38.45 | |
| MA100: | 41.37 | |
| MAexp7: | 42.64 | |
| MAexp20: | 41.78 | |
| MAexp50: | 40.90 | |
| MAexp100: | 40.26 | |
| Price / MA7: | +6.88% | |
| Price / MA20: | +9.22% | |
| Price / MA50: | +12.74% | |
| Price / MA100: | +4.79% | |
| Price / MAexp7: | +1.67% | |
| Price / MAexp20: | +3.76% | |
| Price / MAexp50: | +5.99% | |
| Price / MAexp100: | +7.68% |
Quotes :
-
15 min delayed data
-
Actions NYSE
News
The latest news and videos published on AXOS FINANCIAL INC. at the time of the analysis were as follows:
- New Research: Key Drivers of Growth for BofI Holding, Digimarc, DHT, International Seaways, QEP Resources, and Intelsat S.A. — Factors of Influence, Major Initiatives and Sustained Production
- BofI Holding, Inc to Host Earnings Call
- Lifshitz & Miller LLP Announces Investigation of Bingo Nation Inc., BofI Holding, Inc., Corbus Pharmaceuticals Holdings, Inc., Lion Biotechnologies, Inc., NewLink Genetics Corporation, Power Solutions International, Inc., Walter Investment Management Corp. and XBIOTECH INC.
- EQUITY ALERT: Khang & Khang LLP Announces Securities Class Action Lawsuit against BofI Holding, Inc. and Encourages Investors with Losses to Contact the Firm
- INVESTOR ALERT: Lundin Law PC Announces Securities Class Action Lawsuit against BofI Holding, Inc. and Encourages Investors with Losses to Contact the Firm