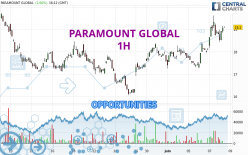
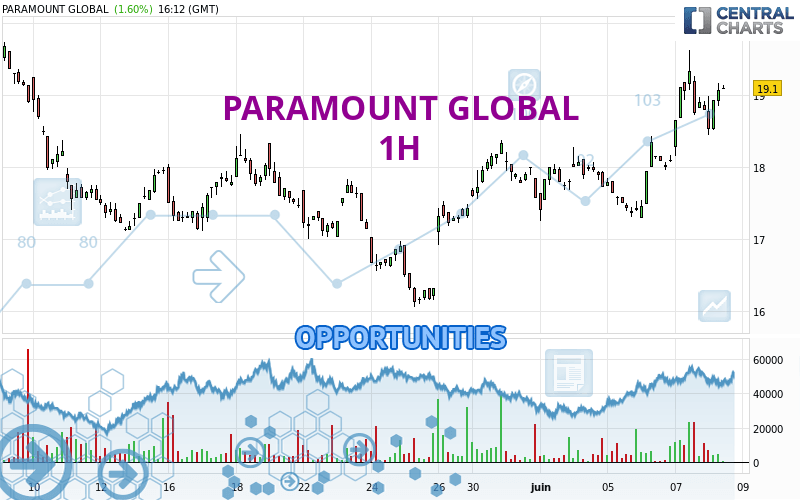
Londinia Opportunities Analyses - 06/08/2023 (GMT) PARAMOUNT GLOBAL - 1H
- U.S. Stocks
- Timeframe : 1H
- - Analysis generated on
- Status : INVALID
Summary of the analysis
Trends
Short term:
Strongly bullish
Underlying:
Strongly bullish
Technical indicators
67%
6%
28%
My opinion
Bullish above 18.60 USD
My targets
19.99 USD (+4.44%)
20.29 USD (+5.99%)
My analysis
All elements being clearly bullish, it would be possible for traders to trade only long positions (at the time of purchase) on PARAMOUNT GLOBAL as long as the price remains well above 18.60 USD. The buyers' bullish objective is set at 19.99 USD. A bullish break in this resistance would boost the bullish momentum. The buyers could then target the resistance located at 20.29 USD. If there is any crossing, the next objective would be the resistance located at 22.12 USD. However, beware of bullish excesses that could lead to a possible short-term correction; but this possible correction would not be tradeable.
Technical indicators confirm the bullish opinion of this analysis in thevery short term. However, be careful of excessive bullish movements. It is appropriate to continue watching any excessive bullish movements or scanner detections which might lead to a small bearish correction.
Force
0
10
7.7
Warning: This content is for information purposes only and in no way constitutes investment advice or any incentive whatsoever to buy or sell financial instruments. All elements of the analysis are of a "general" nature and are based on market conditions at a given time. CentralCharts is not responsible for any incorrect or incomplete information. Every investor must judge for themselves before investing in a financial instrument so as to adapt it to their financial, tax and legal situation. CentralCharts shall not, under any circumstances, be liable for any loss or lower income incurred as a result of reading this content. Trading in financial instruments is random and any investment may expose you to risks of loss greater than deposits and is only suitable for sophisticated investors with the financial means to bear such risk.
Additional analysis
Quotes
The PARAMOUNT GLOBAL price is 19.14 USD. The price registered an increase of +1.81% on the session with the lowest point at 18.45 USD and the highest point at 19.17 USD. The deviation from the price is +3.74% for the low point and -0.16% for the high point.18.45
19.17
19.14
A bearish opening was detected by the Central Gaps scanner. Sellers are trying to impose a bearish trend in the very short term.
Bearish opening
Type : Bearish
Timeframe : Openning
A study of price movements over other periods shows the following variations:
Near a new HIGH record (1 month)
Type : Bullish
Timeframe : Weekly
Technical
Technical analysis of this 1H chart of PARAMOUNT GLOBAL indicates that the overall trend is strongly bullish. 89.29% of the signals given by moving averages are bullish. This strongly bullish trend is supported by the strong bullish signals given by short-term moving averages. The Central Indicators market scanner currently does not detect any result that concerns moving averages.
The technical indicators are bullish. There is still some doubt about the price increase.
Central Indicators, the scanner specialised in technical indicators, has identified this signal:
Pivot points : price is over resistance 2
Type : Neutral
Timeframe : Weekly
Central Patterns, the scanner specializing in chart patterns, did not identify any signals.
Central Candlesticks, the scanner specialised in Japanese candlesticks, detects this inversion signal that could impact the current short-term trend:
Doji
Type : Neutral
Timeframe : 1 hour
ProTrendLines
S3
S2
S1
R1
R2
R3
Price
| S3 | S2 | S1 | Price | R1 | R2 | R3 | |
|---|---|---|---|---|---|---|---|
| ProTrendLines | 16.33 | 17.63 | 18.60 | 19.14 | 19.99 | 22.12 | 24.63 |
| Change (%) | -14.68% | -7.89% | -2.82% | - | +4.44% | +15.57% | +28.68% |
| Change | -2.81 | -1.51 | -0.54 | - | +0.85 | +2.98 | +5.49 |
| Level | Major | Major | Minor | - | Minor | Intermediate | Minor |
To determine price objectives, it is also possible to use the pivot points. Here is the price position in relation to pivot points:
Daily
| Pivot points | S3 | S2 | S1 | PP | R1 | R2 | R3 |
|---|---|---|---|---|---|---|---|
| Standard | 16.63 | 17.39 | 18.10 | 18.86 | 19.57 | 20.33 | 21.04 |
| Camarilla | 18.40 | 18.53 | 18.67 | 18.80 | 18.94 | 19.07 | 19.20 |
| Woodie | 16.60 | 17.38 | 18.07 | 18.85 | 19.54 | 20.32 | 21.01 |
| Fibonacci | 17.39 | 17.96 | 18.30 | 18.86 | 19.43 | 19.77 | 20.33 |
Weekly
| Pivot points | S3 | S2 | S1 | PP | R1 | R2 | R3 |
|---|---|---|---|---|---|---|---|
| Standard | 16.08 | 16.67 | 17.20 | 17.79 | 18.32 | 18.91 | 19.44 |
| Camarilla | 17.42 | 17.53 | 17.63 | 17.73 | 17.83 | 17.94 | 18.04 |
| Woodie | 16.05 | 16.66 | 17.17 | 17.78 | 18.29 | 18.90 | 19.41 |
| Fibonacci | 16.67 | 17.10 | 17.36 | 17.79 | 18.22 | 18.48 | 18.91 |
Monthly
| Pivot points | S3 | S2 | S1 | PP | R1 | R2 | R3 |
|---|---|---|---|---|---|---|---|
| Standard | 2.17 | 9.12 | 13.34 | 20.29 | 24.51 | 31.46 | 35.68 |
| Camarilla | 14.50 | 15.52 | 16.55 | 17.57 | 18.59 | 19.62 | 20.64 |
| Woodie | 0.82 | 8.44 | 11.99 | 19.61 | 23.16 | 30.78 | 34.33 |
| Fibonacci | 9.12 | 13.38 | 16.02 | 20.29 | 24.55 | 27.19 | 31.46 |
Numerical data
The following is the status of technical indicators and moving averages registered at the time this technical analysis was created:
Technical indicators
Moving averages
| RSI (14): | 62.52 | |
| MACD (12,26,9): | 0.3200 | |
| Directional Movement: | 15.52 | |
| AROON (14): | 35.71 | |
| DEMA (21): | 18.98 | |
| Parabolic SAR (0,02-0,02-0,2): | 18.52 | |
| Elder Ray (13): | 0.35 | |
| Super Trend (3,10): | 18.48 | |
| Zig ZAG (10): | 19.10 | |
| VORTEX (21): | 1.1500 | |
| Stochastique (14,3,5): | 64.40 | |
| TEMA (21): | 19.13 | |
| Williams %R (14): | -31.74 | |
| Chande Momentum Oscillator (20): | 1.07 | |
| Repulse (5,40,3): | 1.0200 | |
| ROCnROLL: | 1 | |
| TRIX (15,9): | 0.2300 | |
| Courbe Coppock: | 11.75 |
| MA7: | 18.08 | |
| MA20: | 17.65 | |
| MA50: | 21.72 | |
| MA100: | 23.34 | |
| MAexp7: | 18.93 | |
| MAexp20: | 18.52 | |
| MAexp50: | 18.13 | |
| MAexp100: | 18.20 | |
| Price / MA7: | +5.86% | |
| Price / MA20: | +8.44% | |
| Price / MA50: | -11.88% | |
| Price / MA100: | -17.99% | |
| Price / MAexp7: | +1.11% | |
| Price / MAexp20: | +3.35% | |
| Price / MAexp50: | +5.57% | |
| Price / MAexp100: | +5.16% |
Quotes :
-
15 min delayed data
-
Actions NASDAQ