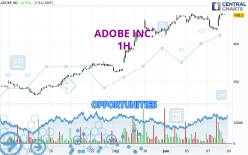
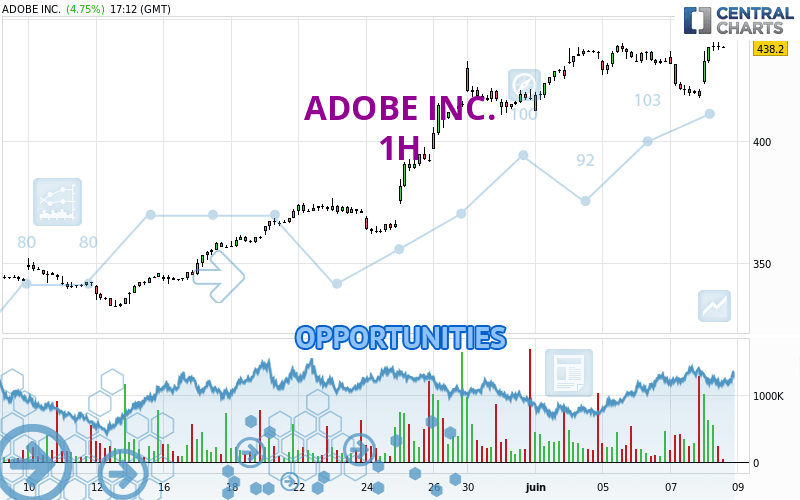
Londinia Opportunities Analyses - 06/08/2023 (GMT) ADOBE INC. - 1H
I am delighted to see that my first price objective has been achieved. I hope you've taken advantage of it.
- U.S. Stocks
- Timeframe : 1H
- - Analysis generated on
- Status : TARGET REACHED
Summary of the analysis
Trends
Short term:
Strongly bullish
Underlying:
Strongly bullish
Technical indicators
72%
11%
17%
My opinion
Bullish above 431.24 USD
My targets
451.02 USD (+2.78%)
474.20 USD (+8.06%)
My analysis
The bullish trend is currently very strong on ADOBE INC.. As long as the price remains above the support at 431.24 USD, you could try to benefit from the boom. The first bullish objective is located at 451.02 USD. The bullish momentum would be boosted by a break in this resistance. Buyers would then use the next resistance located at 474.20 USD as an objective. Crossing it would then enable buyers to target 533.80 USD. Be careful, given the powerful bullish rally underway, excesses could lead to a possible correction in the short term. If this is the case, remember that trading against the trend may be riskier. It would seem more appropriate to wait for a signal indicating reversal of the trend.
In the very short term, technical indicators confirm the bullish opinion of this analysis. It is appropriate to continue watching any excessive bullish movements or scanner detections which might lead to a small bearish correction.
Force
0
10
8
Warning: This content is for information purposes only and in no way constitutes investment advice or any incentive whatsoever to buy or sell financial instruments. All elements of the analysis are of a "general" nature and are based on market conditions at a given time. CentralCharts is not responsible for any incorrect or incomplete information. Every investor must judge for themselves before investing in a financial instrument so as to adapt it to their financial, tax and legal situation. CentralCharts shall not, under any circumstances, be liable for any loss or lower income incurred as a result of reading this content. Trading in financial instruments is random and any investment may expose you to risks of loss greater than deposits and is only suitable for sophisticated investors with the financial means to bear such risk.
Additional analysis
Quotes
The ADOBE INC. rating is 438.82 USD. The price registered an increase of +4.90% on the session and was traded between 423.58 USD and 440.63 USD over the period. The price is currently at +3.60% from its lowest and -0.41% from its highest.423.58
440.63
438.82
The Central Gaps scanner detects a bullish opening. A small advantage for buyers in the very short term.
Bullish opening
Type : Bullish
Timeframe : Openning
A study of price movements over other periods shows the following variations:
Near a new HIGH record (1 year)
Type : Bullish
Timeframe : Weekly
New HIGH record (1st january)
Type : Bullish
Timeframe : Weekly
New HIGH record (1 month)
Type : Bullish
Timeframe : Weekly
Technical
Technical analysis of ADOBE INC. in 1H shows a strongly overall bullish trend. The signals given by the moving averages are 92.86% bullish. This strong bullish trend is confirmed by the strong signals currently being given by short-term moving averages. The Central Indicators scanner does not detect any result on moving averages that would impact this trend.
Technical indicators are strongly bullish, suggesting that the price increase should continue.
Caution: the Central Indicators scanner currently detects an excess:
Williams %R indicator is overbought : over -20
Type : Neutral
Timeframe : 1 hour
Pivot points : price is over resistance 1
Type : Neutral
Timeframe : 1 hour
Central Patterns, the market scanner focusing on chart patterns, resistances and supports found this result:
Near horizontal resistance
Type : Bearish
Timeframe : 1 hour
Central Candlesticks, the scanner specialised in Japanese candlesticks, detects a bearish signal that could support the hypothesis of a small drop in the very short term:
Bearish engulfing lines
Type : Bearish
Timeframe : 1 hour
ProTrendLines
S3
S2
S1
R1
R2
R3
Price
| S3 | S2 | S1 | Price | R1 | R2 | R3 | |
|---|---|---|---|---|---|---|---|
| ProTrendLines | 384.67 | 411.02 | 431.24 | 438.82 | 440.38 | 451.02 | 533.80 |
| Change (%) | -12.34% | -6.34% | -1.73% | - | +0.36% | +2.78% | +21.64% |
| Change | -54.15 | -27.80 | -7.58 | - | +1.56 | +12.20 | +94.98 |
| Level | Major | Minor | Minor | - | Intermediate | Intermediate | Intermediate |
To determine price objectives, it is also possible to use the pivot points. Here is the price position in relation to pivot points:
Daily
| Pivot points | S3 | S2 | S1 | PP | R1 | R2 | R3 |
|---|---|---|---|---|---|---|---|
| Standard | 392.70 | 405.22 | 411.77 | 424.29 | 430.84 | 443.36 | 449.91 |
| Camarilla | 413.08 | 414.82 | 416.57 | 418.32 | 420.07 | 421.82 | 423.56 |
| Woodie | 389.72 | 403.73 | 408.79 | 422.80 | 427.86 | 441.87 | 446.93 |
| Fibonacci | 405.22 | 412.51 | 417.01 | 424.29 | 431.58 | 436.08 | 443.36 |
Weekly
| Pivot points | S3 | S2 | S1 | PP | R1 | R2 | R3 |
|---|---|---|---|---|---|---|---|
| Standard | 390.71 | 400.70 | 418.54 | 428.53 | 446.37 | 456.36 | 474.20 |
| Camarilla | 428.72 | 431.27 | 433.82 | 436.37 | 438.92 | 441.47 | 444.02 |
| Woodie | 394.63 | 402.66 | 422.46 | 430.49 | 450.29 | 458.32 | 478.12 |
| Fibonacci | 400.70 | 411.33 | 417.90 | 428.53 | 439.16 | 445.73 | 456.36 |
Monthly
| Pivot points | S3 | S2 | S1 | PP | R1 | R2 | R3 |
|---|---|---|---|---|---|---|---|
| Standard | 254.36 | 293.12 | 355.46 | 394.22 | 456.56 | 495.32 | 557.66 |
| Camarilla | 389.99 | 399.26 | 408.52 | 417.79 | 427.06 | 436.33 | 445.59 |
| Woodie | 266.14 | 299.02 | 367.24 | 400.12 | 468.34 | 501.22 | 569.44 |
| Fibonacci | 293.12 | 331.74 | 355.60 | 394.22 | 432.84 | 456.70 | 495.32 |
Numerical data
The following are the details of the technical indicators and moving averages that were collected to generate this technical analysis:
Technical indicators
Moving averages
| RSI (14): | 63.12 | |
| MACD (12,26,9): | 1.4400 | |
| Directional Movement: | 14.94 | |
| AROON (14): | 21.43 | |
| DEMA (21): | 432.28 | |
| Parabolic SAR (0,02-0,02-0,2): | 419.90 | |
| Elder Ray (13): | 7.86 | |
| Super Trend (3,10): | 423.61 | |
| Zig ZAG (10): | 438.54 | |
| VORTEX (21): | 0.9600 | |
| Stochastique (14,3,5): | 93.97 | |
| TEMA (21): | 430.49 | |
| Williams %R (14): | -10.39 | |
| Chande Momentum Oscillator (20): | 5.54 | |
| Repulse (5,40,3): | 0.9800 | |
| ROCnROLL: | 1 | |
| TRIX (15,9): | 0.0100 | |
| Courbe Coppock: | 1.70 |
| MA7: | 429.25 | |
| MA20: | 389.74 | |
| MA50: | 377.99 | |
| MA100: | 367.37 | |
| MAexp7: | 432.91 | |
| MAexp20: | 430.47 | |
| MAexp50: | 423.63 | |
| MAexp100: | 408.44 | |
| Price / MA7: | +2.23% | |
| Price / MA20: | +12.59% | |
| Price / MA50: | +16.09% | |
| Price / MA100: | +19.45% | |
| Price / MAexp7: | +1.37% | |
| Price / MAexp20: | +1.94% | |
| Price / MAexp50: | +3.59% | |
| Price / MAexp100: | +7.44% |
Quotes :
-
15 min delayed data
-
Actions NASDAQ
News
The latest news and videos published on ADOBE INC. at the time of the analysis were as follows:
- Adobe Brings World’s First AI-Accelerated Content Supply Chain Solution to Europe To Fuel Experience-Led Growth
- Adobe Summit EMEA Spotlights Major New Innovations and Customer Momentum Across Europe
- Adobe Unveils New Innovations Across Adobe Experience Cloud
- Adobe to Announce Q2 FY2023 Earnings Results & Host Conference Call June 15
- Adobe Unveils Future of Creative Cloud With Generative AI as a Creative Co-Pilot in Photoshop